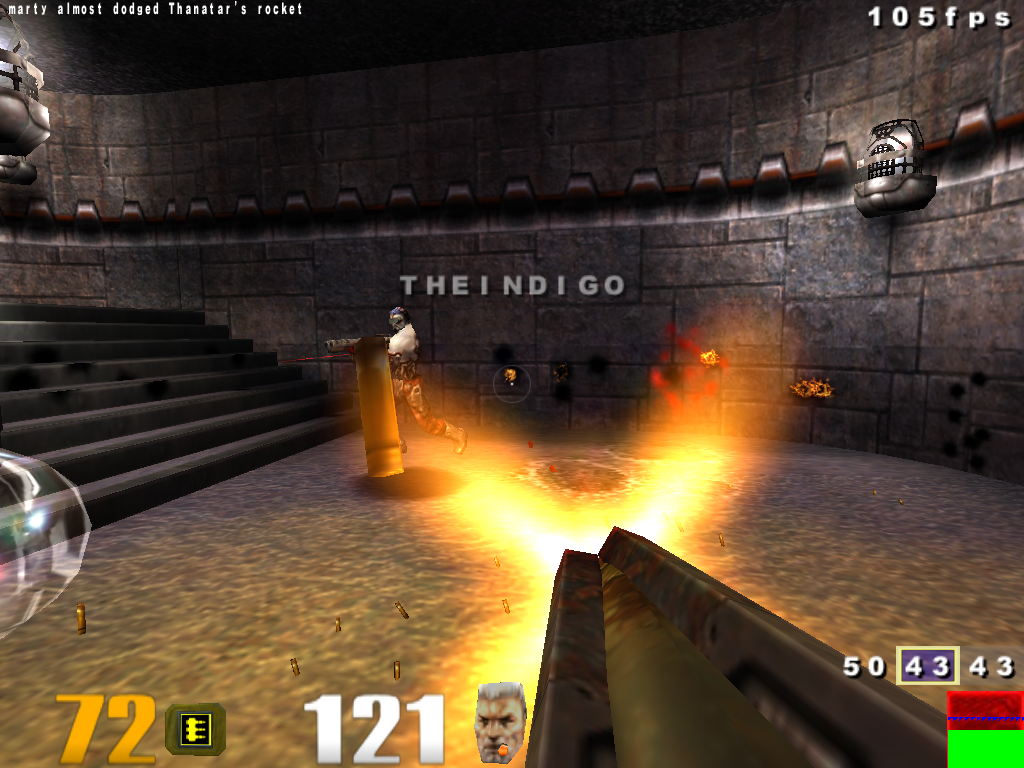
Lately, I have been looking at improving performance of the V3DV Vulkan driver for the Raspberry Pi 4. So far we had been toying a lot with some Vulkan ports of the Quake trilogy but we wanted to have a look at more modern games as well, and for that we started to look at some Unreal Engine 4 samples, particularly the Shooter demo.
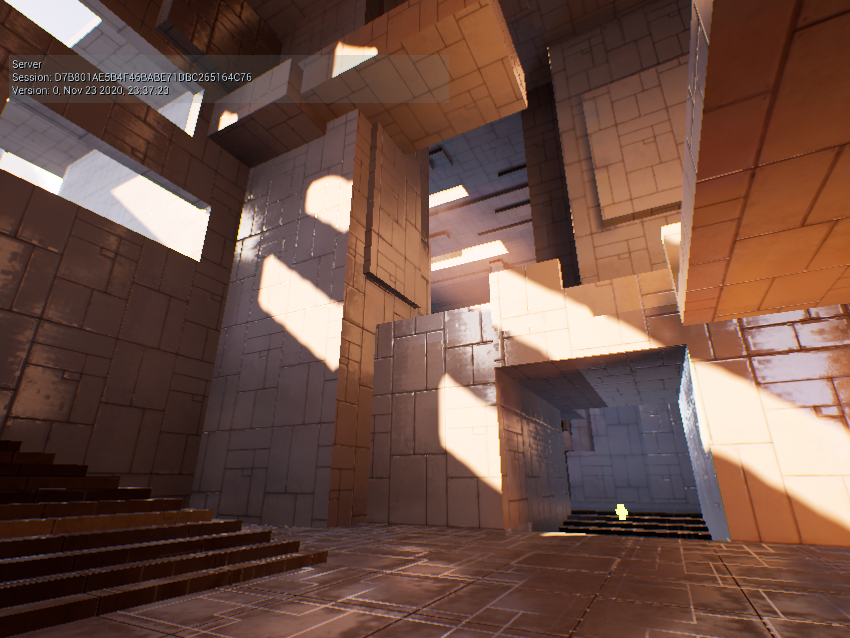
In our initial tests with “High” settings, even at 480p we were running the sample at 8-15 fps, with 720p being mostly in the 5-10 fps range. Not great, obviously, but a good opportunity to guide and focus our performance efforts.
One aspect of the UE4 sample that was immediately obvious compared to the Quake games is that the shading is a lot more expensive in general, and more specifically, it involves more texture lookups and UBO loads, which require expensive accesses to memory from the shader cores, so this was the first area we targeted. The good thing about this is that because our Vulkan and OpenGL drivers share the compiler stack, any optimizations we do here benefit both drivers.
What follows is a brief discussion of some of the optimizations we did recently to our backend compiler and the results we have observed from this work.
Optimizing the backend compiler
So the first thing we tackled was better managing the latency of texture lookups. Interestingly, the NIR scheduler was setting this up so that we would try to put instructions that consumed the result of a texture lookup as far away as possible from the instruction that triggered the lookup, but then the backend compiler was not fully taking advantage of this and would still end up waiting on lookup results sooner than it should.
Fixing this helped performance by 1%-3%, although it could go a bit above that in some cases. It has a caveat though: doing this extends the liveness of our lookup sequences, and that makes spilling more difficult (we can’t emit spills/unspills in the middle of an outstanding memory lookup), so when register pressure is high enough that we need to inject register spills to compile the shader, we would typically be a lot more constrained and end up producing significantly worse code, or even worse, failing to register allocate for the shader completely. To avoid this, we recompile the shader without the optimization if we detect that we need to do any spilling. One can use V3D_DEBUG=perf to detect if this is happening for any shaders, looking for messages like this:
Falling back to strategy 'disable TMU pipelining' for MESA_SHADER_FRAGMENT.
While the above optimization was useful, I was expecting that it would make a larger impact for this particular demo so I kept looking for ways to do our memory lookups more efficient. One thing that is relevant to this analysis is that we were using the same hardware unit for both texture and UBO lookups, but for the latter, we could really use a different strategy by handling our UBOs as uniform streams. This has some caveats, but making a long story short, the fact that many UBO loads use uniform addresses, that we usually read a bunch of consecutive scalars from a UBO load (such as a full vec4) and that applications usually emit UBO loads for nearby addresses together, we can emit fairly optimal code for many of these, leading to more efficient memory access in general.
Eventually, this turned out to be a big win, yielding 20%-30% improvements for the Shooter demo even with the initial basic implementation, which we would then tune and optimize further.
Again related to memory accesses, I have also been improving how we schedule instructions involved with setting up memory lookups. Our scheduler was more restrictive here than it needed, and the extra flexibility can help reduce instruction counts, which will affect these more modern games most, as they are more likely to emit a larger number of texture/image operations in their shaders.
Another thing we did was to improve instruction packing. The V3D GPU is able to emit multiple instructions in the same cycle so long as the instructions meet some requirements. Turns out our assembly scheduler was being too restrictive with this and we could do better. Going by shader-db results, this led to ~5% less instructions on our programs and added another modest 1%-2% performance improvement for the Shooter demo.
Another issue we noticed is that a lot of the shaders were passing a lot of varyings from the vertex to fragment shaders, and our setup for fragment shader inputs was not optimal. The issue here was that there is a specific instruction involved in this process that writes two registers, one of then with an instruction of delay, and our dependency tracking was not able to handle this properly, effectively assuming that both registers are written in the same instruction which then had an impact in how we scheduled instructions. Fixing this required to handle this case specially in our scheduler so we could be more effective at scheduling these instructions in a way that would enable optimal pipelining of the instructions involved with varying setups for fragment shaders.
Another aspect we improved was related to our uniform handling. Generally, there many instances in which we need to emit duplicate uniforms. There are reasons for that related to how the GPU works, but in some cases, for example with consecutive UBO loads, we would emit the uniform with the base address of the UBO multiple times very close to each other. We can obviously do better by trying to track previous uses of a uniform/constant value and reusing them in nearby instructions. Of course, this comes at the expense of increasing register pressure (for reasons beyond the scope of this post our shaders typically require a lot of uniforms), so there is a balancing game to play here too. Reducing the size of our uniform streams this way also plays an important role in lowering some of the CPU overhead of the driver, since these streams need to be rebuilt often when certain pipeline states change.
Finally, an optimization that was more targeted at reducing register pressure rather than improving performance: we noticed that we would sometimes put some instructions far away from their consumers with no obvious benefit to it. This was bad enough some times that it would even cause us to be unable to compile some shaders. Mesa has a handy NIR pass for this called nir_opt_sink, which also proved to be helpful for this. This allowed us to get a few more shaders from shader-db to compile and reduce spilling for a bunch of shaders. For the Shooter demo, this changed a large compute shader involved with histogram post-processing, which had 48 spills and 50 fills to only have 8 spills and 15 fills. While the impact in performance of this is probably very small since the game only runs this pass once per frame, it made a notable difference in loading time, since compiling a shader with this much spilling is very slow at present. I have a mental note to improve this some day, I know Intel managed to fix this for their compiler, but for the time being, this alone managed to make the loading time much more reasonable.
Results
First, here are some shader-db stats, which describe how these optimizations change various statistics for a large collections of real world shaders:
total instructions in shared programs: 14992758 -> 13731927 (-8.41%)
instructions in affected programs: 14003658 -> 12742827 (-9.00%)
helped: 80448
HURT: 4297

total threads in shared programs: 407932 -> 412242 (1.06%)
threads in affected programs: 4514 -> 8824 (95.48%)
helped: 2189
HURT: 34

total uniforms in shared programs: 4069524 -> 3790401 (-6.86%)
uniforms in affected programs: 2267834 -> 1988711 (-12.31%)
helped: 40588
HURT: 1186

total max-temps in shared programs: 2388462 -> 2322009 (-2.78%)
max-temps in affected programs: 897803 -> 831350 (-7.40%)
helped: 30598
HURT: 2464

total spills in shared programs: 6241 -> 5940 (-4.82%)
spills in affected programs: 3963 -> 3662 (-7.60%)
helped: 75
HURT: 24

total fills in shared programs: 14587 -> 13372 (-8.33%)
fills in affected programs: 11192 -> 9977 (-10.86%)
helped: 90
HURT: 14

total sfu-stalls in shared programs: 28106 -> 31489 (12.04%)
sfu-stalls in affected programs: 16039 -> 19422 (21.09%)
helped: 4382
HURT: 6429

total inst-and-stalls in shared programs: 15020864 -> 13763416 (-8.37%)
inst-and-stalls in affected programs: 14028723 -> 12771275 (-8.96%)
helped: 80396
HURT: 4305
Less is better for all stats, except threads. We can see significant improvements across the board: we generally produce shaders with less instructions that have less maximum register pressure, we reduce spills and uniform counts and can run with more threads. We only are worse at stalls, but that is generally because we now produce more compact code with less instructions, so more stalls are expected.
Another good thing in these stats is the large number of helped shaders compared to hurt shaders, meaning that it is very likely that these optimizations will help most applications to some extent.
But enough of boring compiler statistics, most people won’t care about that and what they want to know is how this impacts performance on actual games and applications, which is what the following graphs shows (these were obtained by replaying specific traces with gfx-reconstruct). Keep in mind that while I am using a collection of Vulkan samples/games here it is expected that these optimizations apply to OpenGL too.

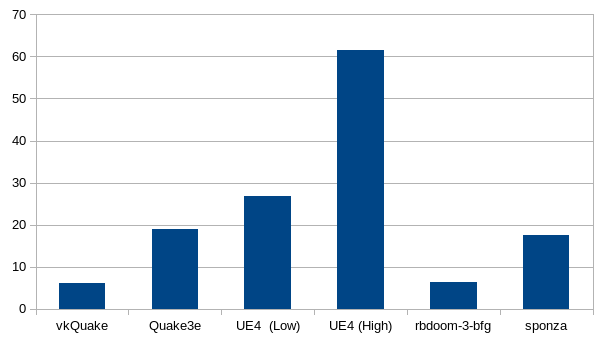
As it can be observed from the graph above, this optimization work made a significant impact in the observed framerate in all the cases. It is not surprising that the UE4 demo is the one that sees the most improvement, considering this the one we used to guide most of the optimization work.
Other optimizations and future work
In this post I have been focusing exclusively on compiler optimizations, but we have also been improving other parts of the Vulkan driver. While I won’t go into details to avoid making this post too long, we have also been improving aspects of the driver involved with buffer to image copies, depth buffer clears, dirty descriptor state management, usage of the TFU unit for transfer operations and more.
Finally, there is one other aspect of this UE4 demo that is pretty obvious as soon as you start a game: it can compile a lot of shaders in the middle of the gameplay loop which can lead to significant stutter. While there is not much we can do about this on the driver side, but adding support for a shader cache on disk should eliminate the problem on sessions after the first, so this is something that we may work on in the future.
We will certainly continue to look at improving the driver performance in the future so stay tuned for further updates on our progress or maybe join us at #videocore on Freenode.