WebKitGTK+ has supported remote debugging for a long time. The current implementation uses WebSockets for the communication between the local browser (the debugger) and the remote browser (the debug target or debuggable). This implementation was very simple and, in theory, you could use any web browser as the debugger because all inspector code was served by the WebSockets. I said in theory because in the practice this was not always so easy, since the inspector code uses newer JavaScript features that are not implemented in other browsers yet. The other major issue of this approach was that the communication between debugger and target was not bi-directional, so the target browser couldn’t notify the debugger about changes (like a new tab open, navigation or that is going to be closed).
Apple abandoned the WebSockets approach a long time ago and implemented its own remote inspector, using XPC for the communication between debugger and target. They also moved the remote inspector handling to JavaScriptCore making it available to debug JavaScript applications without a WebView too. In addition, the remote inspector is also used by Apple to implement WebDriver. We think that this approach has a lot more advantages than disadvantages compared to the WebSockets solution, so we have been working on making it possible to use this new remote inspector in the GTK+ port too. After some refactorings to the code to separate the cross-platform implementation from the Apple one, we could add our implementation on top of that. This implementation is already available in WebKitGTK+ 2.17.1, the first unstable release of this cycle.
From the user point of view there aren’t many differences, with the WebSockets we launched the target browser this way:
$ WEBKIT_INSPECTOR_SERVER=127.0.0.1:1234 browser
This hasn’t changed with the new remote inspector. To start debugging we opened any browser and loaded
http://127.0.0.1:1234
With the new remote inspector we have to use any WebKitGTK+ based browser and load
inspector://127.0.0.1:1234
As you have already noticed, it’s no longer possible to use any web browser, you need to use a recent enough WebKitGTK+ based browser as the debugger. This is because of the way the new remote inspector works. It requires a frontend implementation that knows how to communicate with the targets. In the case of Apple that frontend implementation is Safari itself, which has a menu with the list of remote debuggable targets. In WebKitGTK+ we didn’t want to force using a particular web browser as debugger, so the frontend is implemented as a builtin custom protocol of WebKitGTK+. So, loading inspector:// URLs in any WebKitGTK+ WebView will show the remote inspector page with the list of debuggable targets.
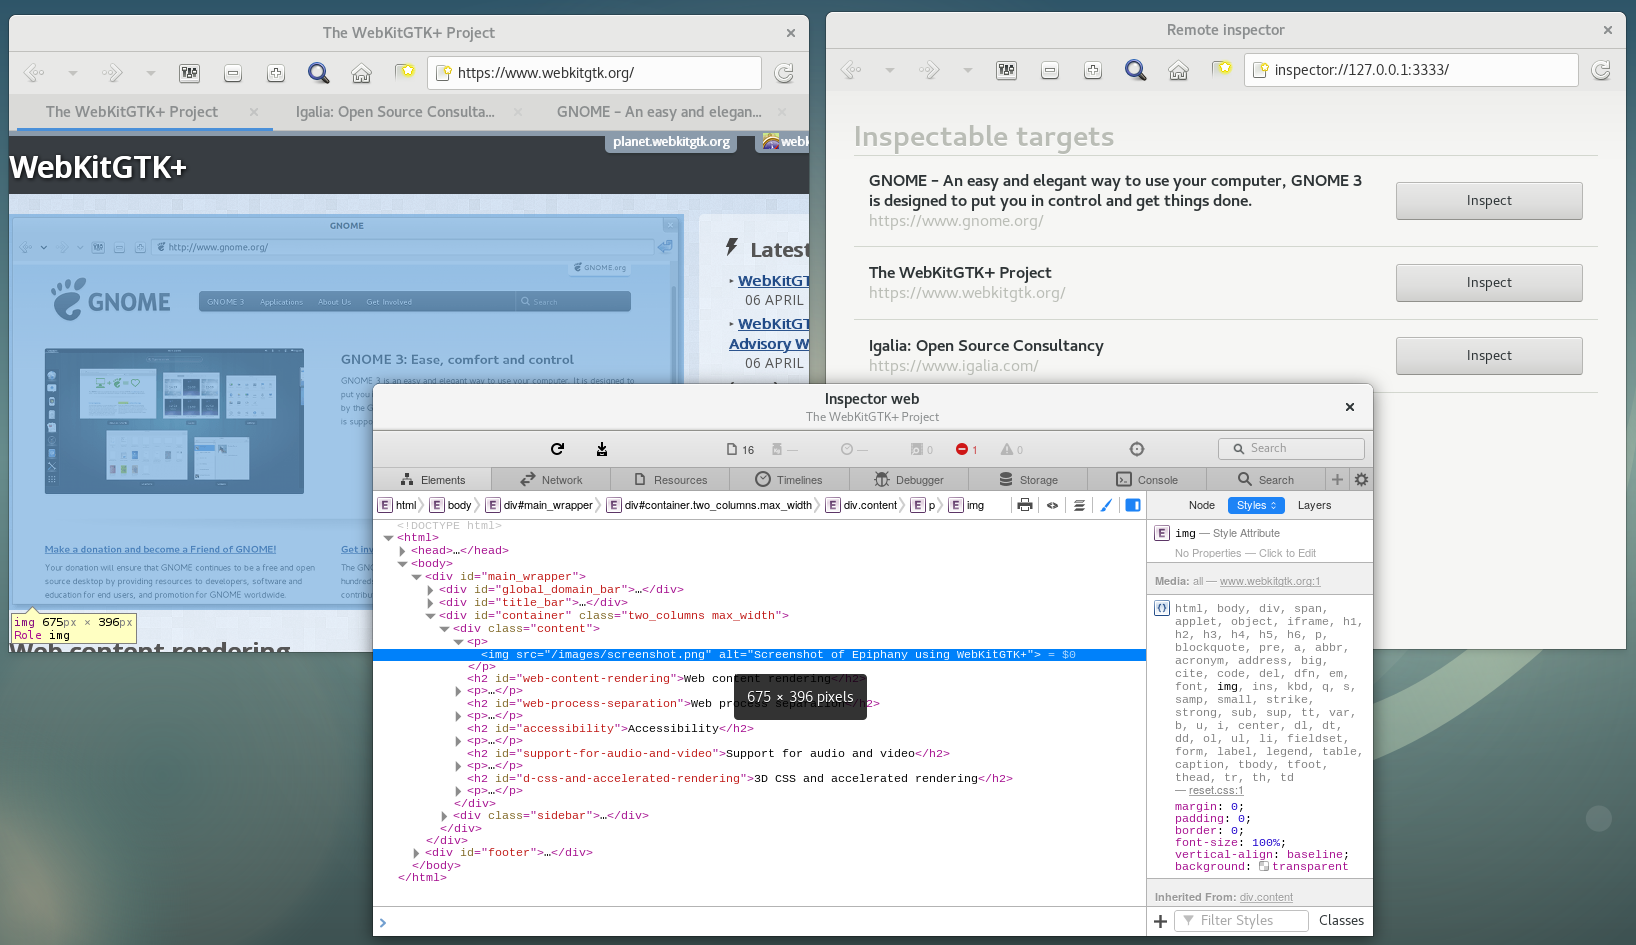
It looks quite similar to what we had, just a list of debuggable targets, but there are a few differences:
- A new debugger window is opened when inspector button is clicked instead of reusing the same web view. Clicking on inspect again just brings the window to the front.
- The debugger window loads faster, because the inspector code is not served by HTTP, but locally loaded like the normal local inspector.
- The target list page is updated automatically, without having to manually reload it when a target is added, removed or modified.
- The debugger window is automatically closed when the target web view is closed or crashed.
How does the new remote inspector work?
The web browser checks the presence of WEBKIT_INSPECTOR_SERVER environment variable at start up, the same way it was done with the WebSockets. If present, the RemoteInspectorServer is started in the UI process running a DBus service listening in the IP and port provided. The environment variable is propagated to the child web processes, that create a RemoteInspector object and connect to the RemoteInspectorServer. There’s one RemoteInspector per web process, and one debuggable target per WebView. Every RemoteInspector maintains a list of debuggable targets that is sent to the RemoteInspector server when a new target is added, removed or modified, or when explicitly requested by the RemoteInspectorServer.
When the debugger browser loads an inspector:// URL, a RemoteInspectorClient is created. The RemoteInspectorClient connects to the RemoteInspectorServer using the IP and port of the inspector:// URL and asks for the list of targets that is used by the custom protocol handler to create the web page. The RemoteInspectorServer works as a router, forwarding messages between RemoteInspector and RemoteInspectorClient objects.
Does this mean that WebKitGTK 2.18 should drop support for connecting to the debug target using websockets?
I’m asking because several external tools (IDEs) might break as a result.
Yes. IDEs will have to be updated to use the new remote debugger. If you know of any specific tool that will be broken and we can help with the migration, just let us know.