Maintaining downstreams of Chromium: why downstream?

Chromium, the web browser open source project Google Chrome is based on, can be considered nowadays the reference implementation of the web platform. As such, it is the first choice when implementing the web platform in a software platform or product.

Why is it like this? In this blog post I am going to introduce the topic, and then review the different reasons why a downstream Chromium is used in different projects.

A series of blog posts

This is the first of a series of blog posts, where I am going through several aspects and challenges of maintaining a downstream project using Chromium as its upstream project.

They will be mostly based on the discussions in two events. First, on The Web Engines Hackfest 2023 break out session with same title that I chaired in A Coruña. Then, on my BlinkOn 18 talk in November 2023, at Sunnyvale.

Some definitions

Before starting the discussion of the different aspects, let’s clarify how I will use several terms.

Repository vs. project

I am going to refer to a repository as a version controlled storage of code strictly. Then, a project (specifically, a software project) is the community of people that share goals and some kind of organization, to maintain one or several software products.

So, a project may use several repositories for their goals.

In this discussion I will talk about Chromium, an open source project that targets the implementation of the web platform user agent, a web browser, for different platforms. As such, it uses a number of repositories (src, v8 and more).

Downstream and upstream

I will use the downstream and upstream terms, referred to the relationship of different software projects version control repositories.

If there is a software project repository (typically open source), and a new repository is created that contains all or part of the original repository, then:

  • Upstream project will be the original repository.
  • Downstream project is the new repository.

It is important to highlight that different things can happen to the downstream repository:

  • This copy could be a one time event, so the downstream repository becomes an independent fork, and there may be no interest in tracking the upstream evolution. This happens often for abandoned repositories, where a different set of people start an independent project. But there could be other reasons.
  • There is the intent to track the upstream repository changes. So the downstream repository evolves as the upstream repository does too, but with some specific differences maintained on top of the original repository.

Why using Chromium?

Nowadays, web platform is a solid alternative for providing contents to the users. It allows modern user interfaces, based on well known standards, and integrate well with local and remote services. The gap between native applications and web contents has been reduced, so it is a good alternative quite often.

But, when integrating web contents, product integrators need an implementation of the web platform. It is no surprise that Chromium is the most used, for a number of reasons:

  • It is open source, with a license that allows to adapt it for new product needs.
  • It is well maintained and up to date. Even pushing through standardization for improving it continuously.
  • It is secure, both from architecture and maintenance model point of view.
  • It provides integration points to tailor the implementation to ones needs.
  • It supports the most popular software platforms (Windows, Android, Linux, …) for integrating new products.
  • On top of the web platform itself, it provides an implementation for many of the components required to build a modern web browser.

Still, there are other good alternate choices for integrating the web, as WebKit (specially WPE for the embedded use cases), or using the system-provided web components (Android or iOS web view, …).

Though, in this blog post I will focus on the Chromium case.

Why downstreaming Chromium?

But, why do different projects need to use downstream Chromium repositories?

The main simple reason the project needs a downstream repository is adding changes that are not upstream. This can be for a variety of reasons:

  • Downstream changes that are not allowed by upstream. I.e. because they will make upstream project harder to maintain, or it will not be tested often.
  • Downstream changes that downstream project does not want to add to upstream.

Let’s see some examples of changes of both types.

Hardware and OS adaptation

This is when downstream adds support for a hardware target or OS that is not originally supported in upstream Chromium project.

Chromium upstream provides an abstraction layer for that purpose named Ozone, that allows to adapt it to the OS, desktop environment, and system graphics compositor. But there are other abstraction layers for media acceleration, accessibility or input methods.

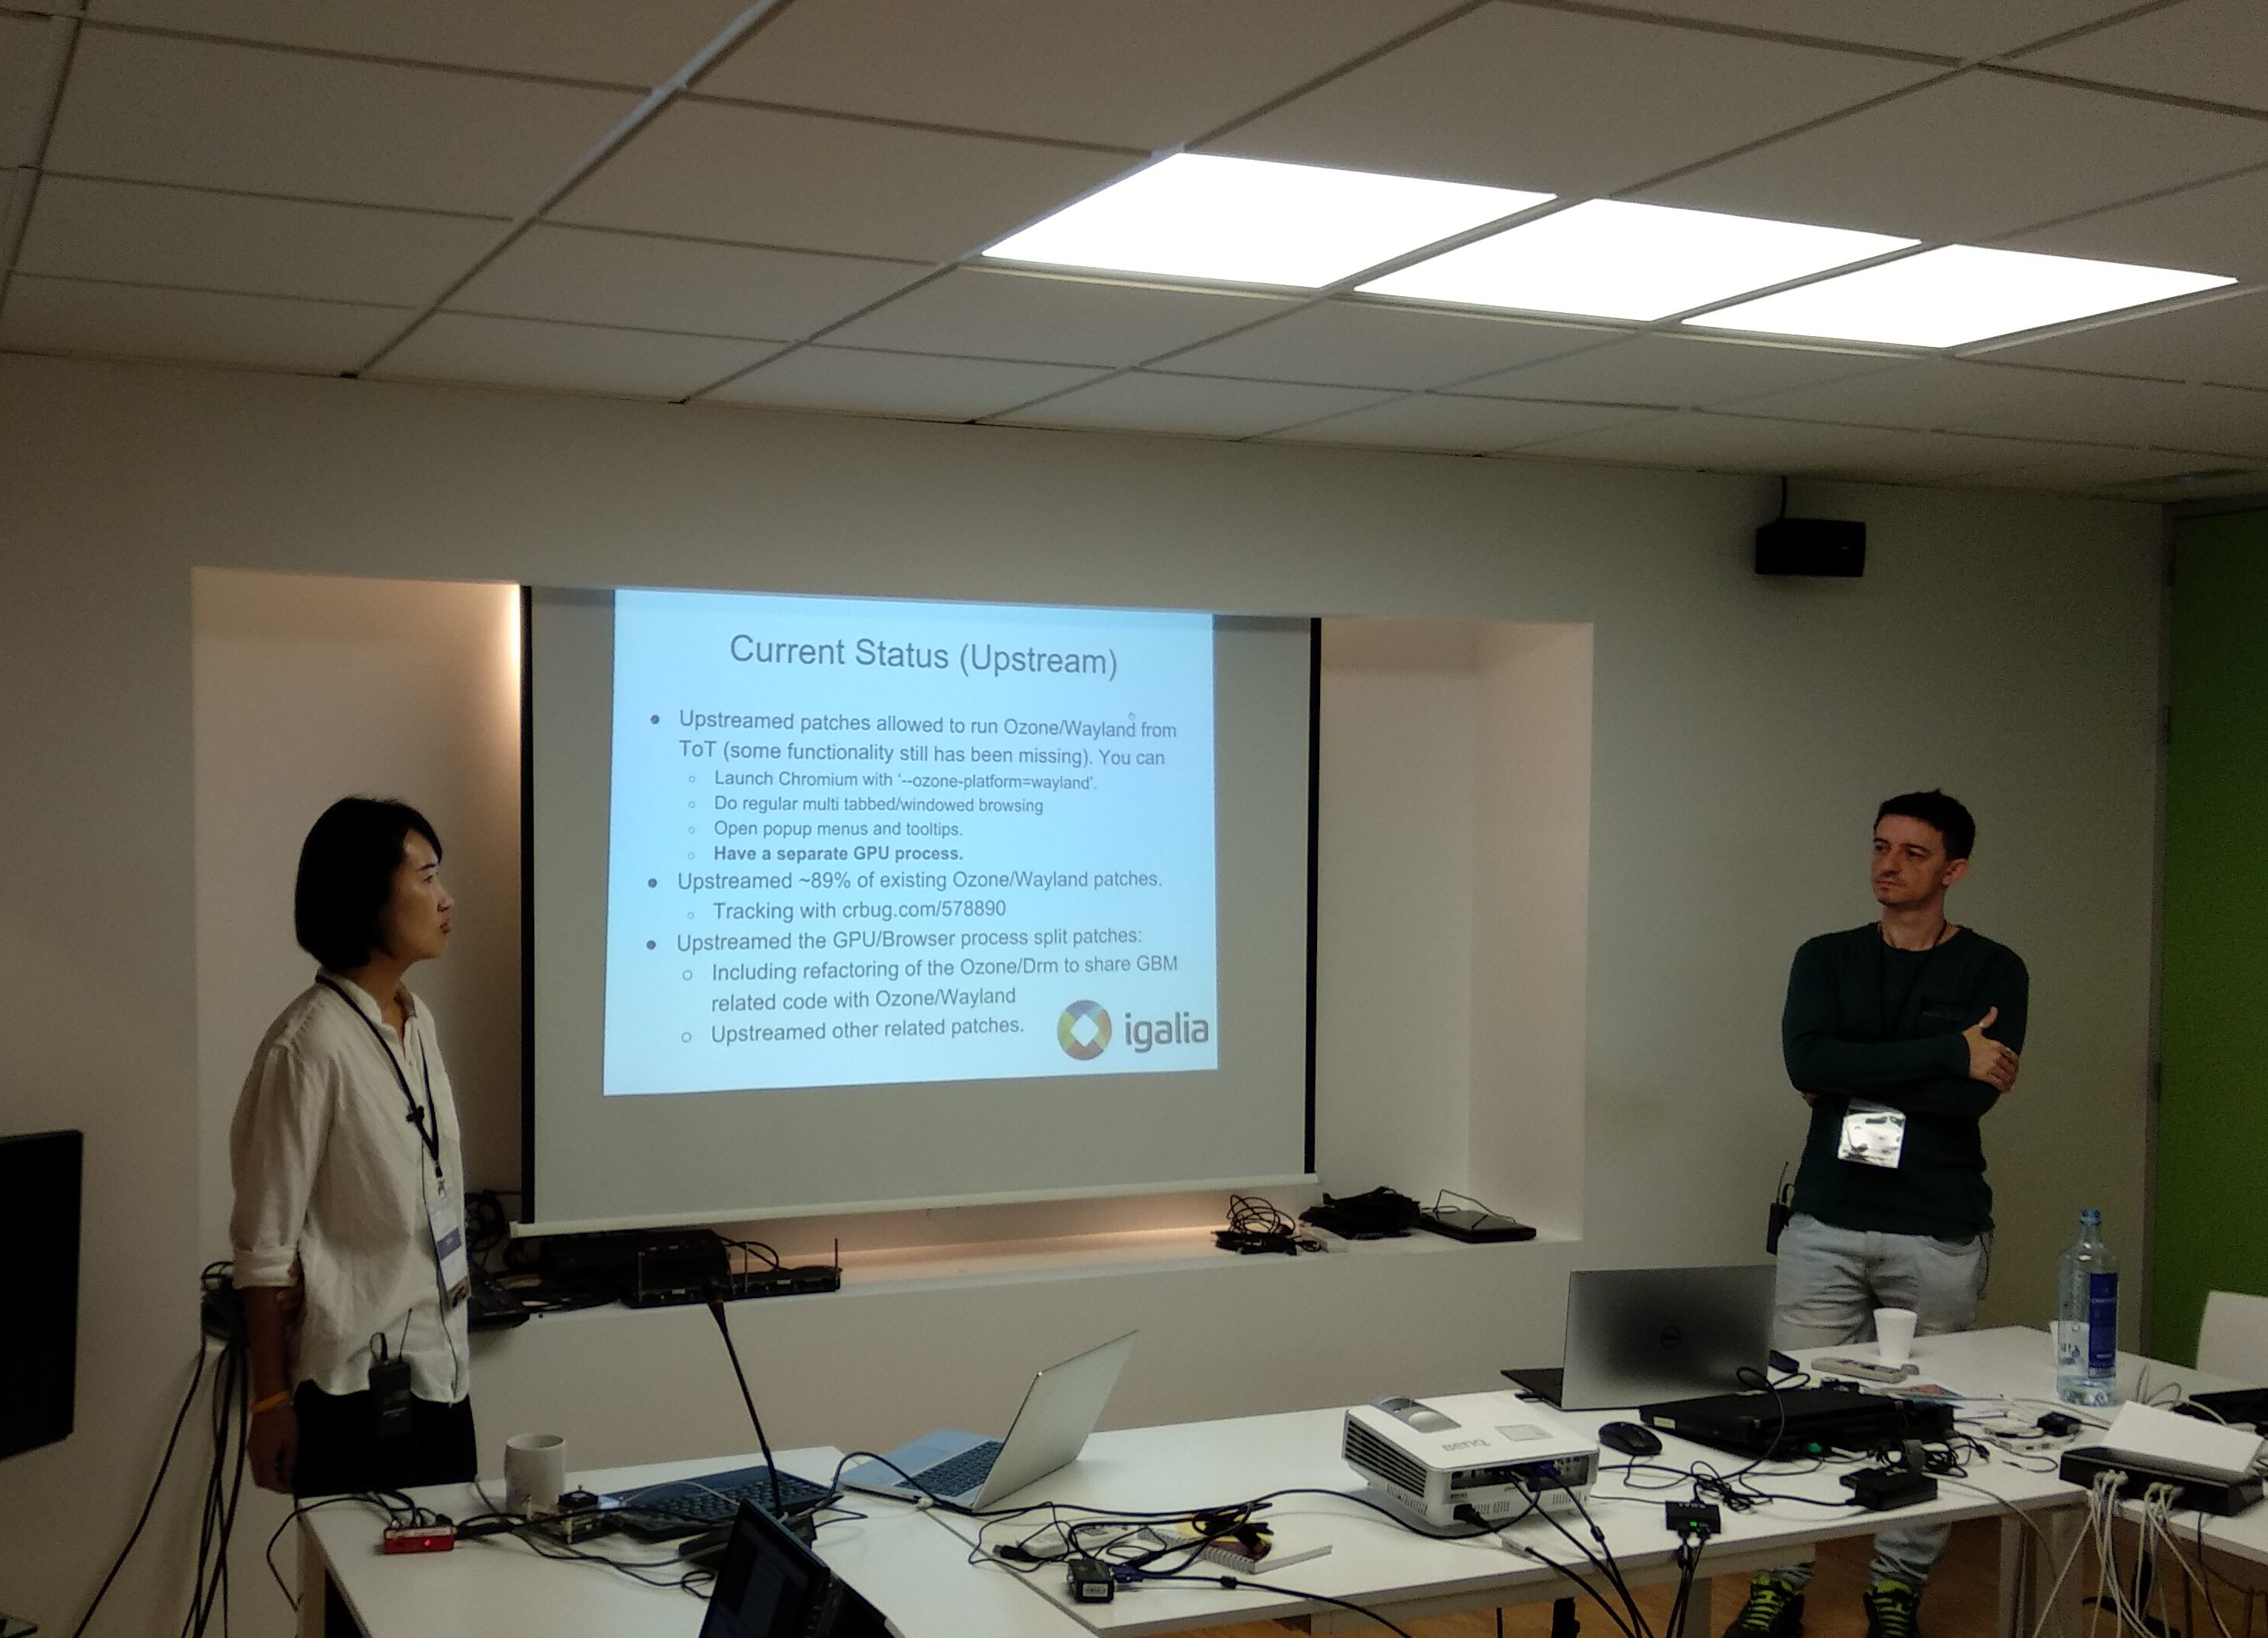
The Wayland protocol adaptation started as a downstream effort, as upstream Chromium did not intend to support Wayland at that time. Eventually it evolved into an upstream official Ozone backend.

An example? LGE webOS Chromium port.

Differentiation

The previous case mostly forces to have a downstream project or repository. But there are also some cases where this is intended. There is the will to have some features in the downstream repository and not in upstream, an intended differentiation.

Why would anybody want that? Some typical examples:

  • A set of features that the downstream project owners consider to make the project better in some way, and want them to be kept downstream. This can happen when a new browser is shipped, and it contains features that make the product offering different, and, in some ways, better, than upstream Chrome. That can be a different user experience, some security features, better privacy…
  • Adaptation to a different product brand. Each browser or browser-based product will want to have its specific brand instead of upstream Chromium brand.

Examples of this:

  • Brave browser, with completely different privacy and security choices.
  • ARC browser, with an innovative user experience.
  • Microsoft Edge, with tight Windows OS integration and corporate features.

Hybrid application runtimes

And one last interesting case: integrating the web platform for developing hybrid applications: those that mix parts of the user interface implemented in a native toolkit, and parts implemented using the web platform.

Though Chromium includes official support for hybrid applications for Android, with the Android Web View, other toolkits provide also web applications support, and the integration of those belong, in Chromium case, to downstream projects.

Examples?

What’s next?

In this blog post I presented different reasons why projects end up maintaining a downstream fork of Chromium.

In the next blog post I will present one of the main challenges when maintaining a downstream of Chromium: the different rebase and upgrade strategies.

V8 profiling instrumentation overhead

In the last 2 years, I have been contributing to improve the performance of V8 profiling instrumentation in different scenarios, both for Linux (using Perf) and for Windows (using Windows Performance Toolkit).

My work has been mostly improving the stack walk instrumentation that allows Javascript generated code to show in the stack traces, referring to the original code, in the same way native compiled code in C or C++ can provide that information.

In this blog post I run different benchmarks to determine how much overhead this instrumentation introduces.

How can you enable profiling instrumentation?

V8 implements system native profile instrumentation for the Javascript code, Both for Linux Perf and for Windows Performance Toolkit. Though, those are disabled by default.

For Windows, the command line switch --enable-etw-stack-walking instruments the generated Javascript code, to emit the source code information for the compiled functions using ETW (Event Tracing for Windows). This gives a better insight of time spent in different functions, specially when stack profiling is enabled in Windows Performance Toolkit.

For Linux Perf, there are several command line switches:
--perf-basic-prof: this emits, for any Javascript generated code, its memory location and a descriptive name (that includes the source location of the function).
--perf-basic-prof-only-functions: same as the previous one, but only emitting functions, excluding other stubs as regular expressions.
--perf-prof: this is a different way to provide the information for Linux Perf. It generates a more complex format specified here. On top of the addresses of the functions, it also includes source code information, even with details about the exact line of code inside the function that is executed in a sample.
--perf-prof-annotate-wasm: this one extends --perf-prof, to add debugging information to WASM code.
--perf-prof-unwinding-info: This last one also extends --perf-prof, but providing experimental support for unwinding info.

And then, we have interpreted code support. V8 does not generate JIT code for everything, and in many cases it runs interpreted code that calls common builtin code. So, in a stack trace, instead of seeing the Javascript method that eventually runs those methods through the interpreter, we see those common methods. The solution? Using --interpreted-frames-native-stack, that adds additional information that identifies which Javascript method in the stack is actually interpreted. This is basic to understand the attribution of running code, especially if it is not considered hot enough to be compiled.

They are disabled by default, is it a problem?

We would ideally want to have all of this profiling support always enabled when we are profiling code. For that, we would want to avoid having to pass any command line switch, so we can profile Javascript workloads without any additional configuration.

But all these command line switches are disabled by default. Why? There are several reasons.

What happens on Linux?

In Linux, Perf profiling instrumentation will unconditionally generate additional files, as it cannot know if Perf is running or not. --perf-basic-prof backend writes the generated information to .map files, and --perf-prof backend writes additional information to jit-*.dump files that will be used later with perf inject -j.

Additionally, the instrumentation requires code compaction to be disabled. This is because code compaction will change the memory location of the compiled code. V8 generates CODE_MOVE internal events for profiler instrumentation. But ETW and Linux Perf backends do not handle those events for a variety of reasons. It has an impact in memory as there is no way to compact the space allocated for code without code move.

So, when we enable any of the Linux Perf command line switches we both generate extra files and take more memory.

And what about Windows?

In Windows we have the same problem with code compaction. We do not support generating CODE_MOVE events so, while profiling, we cannot enable code compaction.

And the emitted ETW events with JIT code position information do still take memory space and make the profile recordings bigger.

But there is an important difference: Windows ETW API allows applications to know when they are being profiled, and even filter that. V8 only emits the code location information for ETW if the application is being profiled, and code compaction is only disabled when profiling is ongoing.

That means the overhead for enabling --enable-etw-stack-walking is expected to be minimal.

What about --interpreted-frames-native-stack? It has also been optimized to generate the extra stack information only when a profile is being recorded.

Can we enable them by default?

For Linux, the answer is a clear no. Any V8 workload would generate profiling information in files, and disabling code compaction makes memory usage higher. These problems happen no matter if you are recording a profile or not.

But, Windows ETW support adds overhead only when profiling! It looks like it could make sense to enable both --interpreted-frames-native-stack and --enable-etw-stack-walking for Windows.

Are we there yet? Overhead analysis

So first, we need to verify the actual overhead because we do not want to introduce a regression by enabling any of these options. I also want to confirm the actual overhead in Linux matches the expectation. To do that I am showing the result of running CSuite benchmarks, included as part of V8. I am capturing both the CPU and memory usage.

Linux benchmarks

The results obtained in Linux are…

Legend:
– REC: recording a profile (Yes, No).
– No flag: running the test without any extra command line flag.
– BP: passing --perf-basic-prof.
– IFNS: passing --interpreted-frames-native-stack.
– BP+IFNS: passing both --perf-basic-prof and --interpreted-frames-native-stack.

Linux results – score:

Test REC Better No flag BP IFNS BP+IFNS
Octane No Higher 9101.2 8953.3 9077.1 9097.3
Yes 9112.8 9041.7 9004.8 9093.9
Kraken No Lower 4060.3 4108.9 4076.6 4119.9
Yes 4078.1 4141.7 4083.2 4131.3
Sunspider No Lower 595.7 622.8 595.4 627.8
Yes 598.5 626.6 599.3 633.3

Linux results – memory (in Kilobytes)

Test REC No flag BP IFNS BP+IFNS
Octane No 244040.0 249152.0 243442.7 253533.8
Yes 242234.7 245010.7 245632.9 252108.0
Kraken No 46039.1 46169.5 46009.1 46497.1
Yes 46002.1 46187.0 46024.4 46520.5
Sunspider No 90267.0 90857.2 90214.6 91100.4
Yes 90210.3 90948.4 90195.9 91110.8

What is seen in the results?
– There is apparently no CPU or memory overhead of --interpreted-frames-native-stack alone. Though there is an outlier while recording Octane memory usage, that could be an error in the sampling process. This is expected as the additional information is only generated while any profiling instrumentation is enabled.
– There is no clear extra cost in memory for recording vs not recording. This is expected as the extra information only depends on having the switches enabled. It does not detect when recording is ongoing.
– There is, as expected, a cost in CPU when Perf is ongoing, in most of the cases.
--perf-basic-prof has CPU and memory impact. And combined with --interpreted-frames-native-stack, the impact is even higher as expected.

This is on top of the fact that files are generated. The benchmarks back not enabling Perf --perf-basic-prof by default. But as --interpreted-frames-native-stack has only overhead in combination with profiling switches, it could make sense to consider enabling it on Linux.

Windows benchmarks

What about Windows results?

Legend:
– No flag: running the test without any extra command line flag.
– ETW: passing --enable-etw-stack-walking.
– IFNS: passing --interpreted-frames-native-stack.
– ETW+IFNS: passing both --enable-etw-stack-walking and --interpreted-frames-native-stack.

Windows results – score:

Test REC Better No flag ETW IFNS ETW+IFNS
Octane No Higher 8323.8 8336.2 8308.7 8310.4
Yes 8050.9 7991.3 8068.8 7900.6
Kraken No Lower 4273.0 4294.4 4303.7 4279.7
Yes 4380.2 4416.4 4433.0 4413.9
Sunspider No Lower 671.1 670.8 672.0 671.5
Yes 693.2 703.9 690.9 716.2

Windows results – memory:

Test REC No flag ETW IFNS ETW+IFNS
Octane Not recording 202535.1 204944.9 200700.4 203557.8
Recording 205125.8 204801.3 206856.9 209260.4
Kraken Not recording 76188.2 76095.2 76102.1 76188.5
Recording 76031.6 76265.0 76215.6 76662.0
Sunspider Not recording 31784.9 31888.4 31806.9 31882.7
Recording 31848.9 31882.1 31802.7 32339.0

What is observed?
– No memory or CPU overhead is observed when recording is not ongoing, with --enable-etw-stack-walking and/or --interpreted-frames-native-stack.
– Even recording, there is no clearly visible overhead of --interpreted-frames-native-stack.
– When recording, --enable-etw-stack-walking has an impact on CPU. But not on memory.
– When --enable-etw-stack-walking and --interpreted-frames-native-stack are combined, while recording, both memory and CPU overheads are observed.

So, again, it should be possible to enable --interpreted-frames-native-stack on Windows by default as it only has impact while recording a profile with --enable-etw-stack-walking. And it should be possible to enable --enable-etw-stack-walking by default too as, again, the impact happens only when a profile is recorded.

Windows: there are still problems

Is it that simple? Is it just OK only adding overhead when recording a profile?

One problem with this is that there is an impact in system wide recordings, even if the focus is not on Javascript execution.

Also, the CPU impact is not linear. Most of it happens when a profile recording starts, V8 emits the code position of all the methods in all the already existing Javascript functions and builtins. Now, imagine a regular desktop with several V8 based browsers as Chrome and Edge, with all their tabs. Or a server with many NodeJS instances. All that generates the information of all their methods at the same time.

So the impact of the overhead is significant, even if it only happens while recording.

Next steps

For --interpreted-frames-native-stack it looks like it would be better to propose enabling it by default in all studied platforms (Windows and Linux). It significantly improves the profiling instrumentation, and it has impact only when actual instrumentation is used. And then it still allows disabling it for the specific cases where the original builtins recording is preferred.

For --enable-etw-stack-walking, it could make sense to also propose enabling it by default, even with the known overhead while recording profiles. And just make sure there are no surprise regressions.

But, likely, the best option is trying to reduce that overhead. First, by allowing to filter better which processes generate the additional information from Windows Performance Recorder. And then, also, by reducing the initial overhead as much as possible. I.e. a big part of it is emitting the builtins and V8 snapshot compiled functions for each of the contexts again and again. Ideally we want to avoid that duplication if possible.

Wrapping up

While on Linux, enabling profile instrumentation with command line switches is not an option, Windows dynamically enabling instrumentation allows to consider enabling ETW support by default. But there are still optimization opportunities that could be addressed before.

Thanks!

This report has been done as part of the collaboration between Bloomberg and Igalia. Thanks!


Keep GCC running (2023 update)

Last week I attended BlinkOn 18 in Sunnyvale Google offices. For the 5th time I presented the status of Chromium build using the GNU toolchain components: GCC compiler and libstdc++ standard library implementation.

This blog post recaps the current status in 2023, as it was presented in the conference.

Current status

First things first: GCC is still maintained, and working, on the official development releases! Though, as official build bots will not check that, fixes usually take a few extra days to land.

This is the result of the work from contributors of several companies (Igalia, LGE, Vewd and others). But most important, from individual contributors (last 2 years the main contributor, with more than 50% of the commit has been Stephan Hartmann from Gentoo).

GCC support

The work to support GCC is coordinated from the GCC Chromium meta bug.

Since I started tracking the GCC support we have been getting a quite stable number of contributions, 70-100 per year. Though in 2023 (even if we are counting only 8 months on this chart), we are way below 40.

What happened? I am not really sure. Though, I have some ideas. First, simply as we move to newer versions of GCC, the implementation of recent C++ standards have improved. But then, also, this is the result of the great work that has been done recently in both GCC and LLVM, and also in standarization process, to get more interoperable implementations.

Main GCC problems

Now, I will focus on the most frequent causes for build breakage affecting GCC since January 2022.

Variable clashes

The rules for visibility in C++ are slightly different in GCC. An example: if a class declares a getter with the same name of a declared type in current namespace, Clang will be mostly Ok with that. But GCC will fail with an error.

Bad:

using Foo = int;

class A {
    ...
    Foo Foo();
    ...
}

A possible fix is renaming the accessor method name:

Foo GetFoo();

Or using a explicit namespace for the type:

::Foo GetFoo()

Ambiguous constructors

GCC may sometimes fail to resolve which constructor to use when there is an implicit type conversion. To avoid that, we can make that conversion explicit or use all braces initializers.

constexpr is more strict in GCC

In GCC a constexpr method declared as default demands all its parts to be also declared constexpr:

Bad

int MethodA() { ... };

constexpr MethodB() { ... MethodA() ... };

Two possible fixes: or dropping constexpr from the using method, or adding constexpr to all used methods.

noexcept strictness

noexcept strictness in GCC and Clang is the same when exceptions are enabled, requiring that all invoked functions used from a noexcept are also noexcept. Though, when exceptions are disabled using -fno-exception, Clang will ignore the errors. But GCC will still check the rules.

This works in Clang and not in GCC if -fno-exception is set:

class A {
    ...
    virtual int Method();
};

class B {
    ...
    int Method() noexcept override;
};

CPU intrinsics casts

Implicit casts of CPU intrinsic types will fail in GCC, requiring explicit conversion or cast.

As example:

int8_t input __attribute__((vector_size(16)));
uint16_t output = _mm_movemask_epi8(input);

If we see the declaration of the intrinsic call:

int _mm_movemask_epi8 (__m128i a);

GCC will not allow implicit casting from an int8_t __attribute__((vector_size(16))), though the storage is the same. In GCC we require a reinterpret_cast:

int8_t input __attribute__((vector_size(16)));
uint16_t output = _mm_movemask_epi8(reinterpret_cast<__m128i>(input));

Template specializations need to be in a namespace scope

Template specializations are not allowed in GCC if they are not in a namespace scope. Usually this error materializes with developers adding the template specialization in the templated class scope.

A failing example:

namespace a {
    class A() {
        template<typename T>
        T Foo(const T&t ) {
            ...
        }

        template<>
        size_ Foo(const size_t& t)
    };
}

The fix is moving the template specialization to the namespace scope:

namespace a {
    class A() {
        template<typename T>
        T Foo(const T&t ) {
            ...
        }
    };

    template<>
    size_ A::Foo(const size_t& t) {
        ...
    }
}

libstdc++ support

Regarding the C++ standard library implementation from GNU project, the work is coordinated in the libstdc++ Chromium meta bug.

We have definitely observed a big increase of required fixes in 2022, and projection of 2023 is going to be similar.

In this case there are two possible reasons. One is that we are more exhaustively tracking the work using the meta bug.

Main libstdc++ problems

In the case of libstdc++, these are the most frequent causes for build breakage since January 2022.

Missing includes

The libc++ implementation is different from libstdc++. And that implies some library headers that could be indirectly included in libc++ are not in libstdc++.

STL containers not allowing const members

Let’s see this code:

std::vector<const int> v;

In Clang, this is allowed. Though, in GCC there is an explicit assert forbidding it: std::vector must have a non-const, non-volatile value_type.

This is not only specific to std::vector, but also to std::unordered:*, std::list, std::set, std::deque, std::forward_list or std::multiset.

The solution? Just do not use const as members:

std::vector<int> v;

Destructor of unique_ptr requires declaration of contained type

Assigning from nullptr to std::unique_ptr requires destructor declaration

class A;

std::unique_ptr<A> GetValue() {
    return nullptr;
}

Usually it is just needed to include the full declaration of the class, as it needs the size of the type for the default destructor.

Yocto meta-chromium layer

In my case, to verify GCC and libstdc++ support, on top of building Chromium in Ubuntu using both, I am also maintaining a Yocto layer that builds Chromium development releases. I usually try to verify the build in less than a week after each release.

The layer is available at github.com/Igalia/meta-chromium

I am regularly testing the build using core-image-weston in both Raspberry PI 4 (64 bits) and Intel x86-64 (using Qemu). There I try both X11 and Wayland Ozone backends.

Wrapping up

I would still recommend people to move to use the officially supported Chromium toolchains: libc++ and Clang. With them, downstreams get a far more tested implementation, more security features, or better integration for sanitizers. But, meanwhile, I expect things will still be kept working as several downstreams and distributions will still ship Chromium on top of the GNU toolchains.

Even with the GNU toolchain not being officially supported in Chromium, the community has been successful providing support for both GCC and libstdc++. Thanks to all the contributors!

Javascript memory profiling with heap snapshot

In both web and NodeJS worlds, the main runtime for executing program logic is the Javascript runtime. Because of that, a huge number of applications and user interfaces are using it. As any software component, Javascript code uses resources of the system, that are not unlimited. We should be careful when using CPU time, application storage, or memory.

In this blog post we are going to focus on the latter.

Where’s my memory!

Usually the objects allocated by a web page are not a lot, so they do not eat a huge amount of memory for a modern and beefy computer. But we find problems like:

  • Oh, but I don’t have a single web page loaded. I like those 40-80 tabs all open for some reason… Well, no, there’s no reason for that! But that’s another topic.
  • Many users are not using beefy phones or computers. So using memory has an impact on what they can do.

The user may not be happy with the web application developer implementation choices. And this developer may want to be… more efficient. Do something.

Where’s my memory! The cloud strikes back

Now… Think about the cloud providers. And developers implementing software using NodeJS in the cloud. The contract with the provider may limit the available memory… Or get money depending on the actual usage.

So… An innocent script that takes 10MB, but is run thousands or millions or times for a few seconds. That is expensive!

These developers will need to make their apps… again, more efficient.

A new hope

In performance problems, we usually want to have reliable data of what is happening, and when. Memory problems are no different. We need some observability of the memory usage.

Chromium and NodeJS share their Javascript runtime, V8, and it provides some tools to help with memory investigation.

In this post we are going to focus on the family of tools around a V8 feature named heap snapshot, that allows capturing the memory usage at any time in a Javascript execution context.

About the heap

❗ This is a fast recap on how Javascript heap works, you can skip it if you want

In V8 Javascript runtime, variables, no matter their scope, are allocated on a heap. No matter if it is a number, a string, an object or a function, all of them are stored there. Not only that, in V8 even the code is stored in the heap.

But, in Javascript, memory is freed lazily, with a garbage collection. This means that, when an object is not used anymore, its memory is not immediately disposed. Garbage collector will explore which objects are disposable later, and free them when it is convenient.

How do we know if an object is still used? The idea is simple: objects are used if they can be accessed. To find out which ones, the runtime will take the root objects, and explore recursively all the object references. Any object that has not been found in that exploration can be discarded.

OK, and what is a root object? In a script it can be the objects in the global context. But also Javascript objects referred from native objects.

More details of how the V8 garbage collector works are out of the scope of this post. If you want to learn more, this post should provide a good overview of current implementation: Trash talk: the Orinoco garbage collector.

Heap snapshot: how does it work?

OK, so we know all the Javascript memory allocation goes through the heap. And, as I said, heap snapshot is a tool to investigate memory problems.

The name is quite explicit about how it works. Heap snapshot will stop the Javascript execution, traverse all the heap, analyze it, and dump it in a meaningful format that can be investigated.

What kind of information does it have?

  • Which objects are in the heap, and their types.
  • How much memory each object takes.
  • The references between them, so we can understand which object is keeping another one from being disposed.
  • In some of the tools, it can also store the stack trace of the code that allocated that memory.

The format of those snapshots is using JSON, and it can be opened from Chromium developer tools for analysis.

Heap snapshots from Chromium

In the Chromium browser, heap snapshots can be obtained from the Chrome developer tools, accessed through the Inspect right button menu option.

This is common to any browser based in Chromium exposing those developer tools locally or remotely.

Once the developer tools are visible, there is the Memory tab:

We can select three profiling types:

  • Heap snapshot: it just captures the heap at the specific moment it is captured.
  • Allocation instrumentation on timeline: this records all the allocations over time, in a session, allowing to check the allocation that happened in a specific time range. This is quite expensive, and suitable only for short profiling sessions.
  • Allocation sampling: instead of capturing all allocations, this one records them with sampling. Not as accurate as allocation instrumentation, but very lightweight, allowing to give a good approximation for a long profiling session.

In all cases, we will get a profiling report that we can analyze later.

Heap snapshots from NodeJS

Using Chromium dev tools UI

In NodeJS, we can attach the Chrome dev tools passing --inspect through the command line or the NODE_OPTIONS environment variable. This will attach the inspector to NodeJS, but it does not stop execution. The variant --inspect-brk will break on debugger at start of the user script.

How does it work? It will open a port in localhost:9229, and then this can be accessed from Chromium browser URL chrome://inspect. The UI allows users to select which hosts to listen to for Node sessions. The end point can be modified using --inspect=[HOST:]PORT, --inspect-brk=[HOST:]PORT or with the specific command line argument --inspect-port=[HOST:]PORT.

Once you attach dev tools inspector, you can access the Memory tab as in the case of Chromium

There is a problem, though, when we are using NODE_OPTIONS. All instances of NodeJS will take the same parameter, so they will try to attach to the same host and port. And only the first instance will get the port. So it is less useful than we would expect for a session running multiple NodeJS processes (as it can be just running NPM or YARN to run stuff).

Oh, but there are some tricks!:

  • If you pass port 0 it will allocate a port (and report it through the console!). So you can inspect any arbitrary session (more details).
  • In POSIX systems such as Linux, the inspector will be enabled if the process receives SIGUSR1. This will run in default localhost:9229 unless a different setting is specified with --inspect-port=[HOST:]PORT (more details).

Using command line

Also, there are other ways to obtain heap snapshots directly, without using developer tools UI. NodeJS allows to pass different command line parameters for programming heap snapshot capture/profiling:

  • --heapsnapshot-near-heap-limit=N will dump a heap snapshot when the V8 heap is close to its maximum size limit. The N parameter is the number of times it will dump a new snapshot. This is important because, when V8 is reaching the heap limit, it will take measures to free memory through garbage collection, so in a pattern of growing usage we will hit the limit several times.
  • --heapsnapshot-signal=SIGNAL will dump heap snapshots every time the NodeJS process gets the UNIX signal SIGNAL.

We can also record a heap profiling session from the start of the process to the end (same kind of profiling we obtain from Dev Tools using Allocation sampling option) using command line option --heap-prof. This will sample continuously the memory allocations, and can be tuned using different command line parameters as documented here.

Analysis of heap snapshots

The scope of this post is about how to capture heap snapshots in different scenarios. But… once you have them… You will want to use that information to actually understand memory usage. Here are some good reads about how to use heap snapshots.

First, from Chrome DevTools documentation:

  • Memory terminology: it gives a great tour on how memory is allocated, and what heap snapshots try to represent.
  • Fix memory problems: this one provides some examples of how to use different tools in Chromium to understand memory usage, including some heap snapshot and profiling examples.
  • View snapshots: a high level view of the different heap snapshot and profiling tools.
  • How to Use the Allocation Profiler Tool: this one specific to the allocation profiler.

And then, from NodeJS, you have also a couple of interesting things:

  • Memory Diagnostics: some of this has been covered in this post, but still has an example of how to find a memory leak using Comparison.
  • Heap snapshot exercise: this is an exercise including a memory leak, that you can hunt with heap snapshot.

Recap

  • Memory is a valuable resource that Javascript (both web and NodeJS) application developers may want to profile.
  • As usual, when there are resource allocation problems, we need reliable and accurate information about what is happening and when.
  • V8 heap snapshots provide such information, integrated with Chromium and NodeJS.

Next

In a follow up post, I will talk about several optimizations we worked on, that make V8 heap snapshot implementation faster. Stay tuned!

Thanks!

This work has been thanks to the sponsorship from Igalia and Bloomberg.


Stack walk profiling NodeJS in Windows

Last year I wrote a series of blog posts (1, 2, 3) about stack walk profiling Chromium using Windows native tools around ETW.

A fast recap: ETW support for stack walking in V8 allows to show V8 JIT generated code in the Windows Performance Analyzer. This is a powerful tool to analyze work loads where Javascript execution time is significant.

In this blog post, I will cover the usage of this very same tool, but to analyze NodeJS execution.

Enabling stack walk JIT information in NodeJS

In an ideal situation, V8 engines would always generate stack walk information when Windows is profiling. This is something we will want to consider in the future, as we prove enabling it has no cost if we are not in a tracing session.

Meanwhile, we need to set the V8 flag --enable-etw-stack-walking somehow. This will install hooks that, when a profiling session starts, will emit the JIT generated code addresses, and the information about the source code associated to them.

For a command line execution of NodeJS runtime, it is as simple as passing the command line flag:

node --enable-etw-stack-walking

This will work enabling ETW stack walking for that specific NodeJS session… Good, but not very useful.

Enabling ETW stack walking for a session

What’s the problem here? Usually, NodeJS is invoked indirectly through other tools (based or not in NodeJS). Some examples are Yarn, NPM, or even some Windows scripts or link files.

We could tune all the existing launching scripts to pass --enable-etw-stack-walking to the NodeJS runtime when it is called. But that is not much convenient.

There is a better way though, just using NODE_OPTIONS environment variable. This way, stack walking support can be enabled for all NodeJS calls in a shell session, or even system wide.

Bad news and good news

Some bad news: NodeJS was refusing --enable-etw-stack-walking in NODE_OPTIONS. There is a filter for which V8 options it accepts (mostly for security purposes), and ETW support was not considered.

Good news? I implemented a fix adding the flag to the list accepted by NODE_OPTIONS. It has been landed already, and it is available from NodeJS 19.6.0. Unfortunately, if you are using an older version, then you may need to backport the patch.

Using it: linting TypeScript

To explain how this can be used, I will analyse ESLint on a known workload: TypeScript. For simplicity, we are using the lint task provided by TypeScript.

This example assumes the usage of Git Bash.

First, clone TypeScript from GitHub, and go to the cloned copy:

git clone https://github.com/microsoft/TypeScript.git
cd TypeScript

Then, install hereby and the dependencies of TypeScript:

npm install -g hereby
npm ci

Now, we are ready to profile the lint task. First, set NODE_OPTIONS:

export NODE_OPTIONS="--enable-etw-stack-walking"

Then, launch UIForETW. This tool simplifies capturing traces, and will provide good defaults for Javascript ETW analysis. It provides a very useful keyboard shortcut, <Ctrl>+<Win>+R, to start and then stop a recording.

Switch to Git Bash terminal and do this sequence:

  • Write (without pressing <Enter>): hereby lint
  • Press <Ctrl>+<Win>+R to start recording. Wait 3-4 seconds as recording does not start immediately.
  • Press <Enter>. ESLint will traverse all the TypeScript code.
  • Press again <Ctrl>+<Win>+R to stop recording.

After a few seconds UIForETW will automatically open the trace in Windows Performance Analyzer. Thanks to settings NODE_OPTIONS all the child processes of the parent node.exe execution also have stack walk information.

Randomascii inclusive (stack) analysis

Focusing on node.exe instances, in Randomascii inclusive (stack) view, we can see where time is spent for each of the node.exe processes. If I take the bigger one (that is the longest of the benchmarks I executed), I get some nice insights.

The worker threads take 40% of the CPU processing. What is happening there? I basically see JIT compilation and garbage collection concurrent marking. V8 offloads that work, so there is a benefit from a multicore machine.

Most of the work happens in the main thread, as expected. And most of the time is spent parsing and applying the lint rules (half for each).

If we go deeper in the rules processing, we can see which rules are more expensive.

Memory allocation

In total commit view, we can observe the memory usage pattern of the process running ESLint. For most of the seconds of the workload, allocation grows steadily (to over 2GB of RAM). Then there is a first garbage collection, and a bit later, the process finishes and all the memory is deallocated.

More findings

At first sight, I observe we are creating the rules objects for all the execution of ESLint. What does it mean? Could we run faster reusing those? I can also observe that a big part of the time in main thread leads to leaves doing garbage collection.

This is a good start! You can see how ETW can give you insights of what is happening and how much time it takes. And even correlate that to memory usage, File I/O, etc.

Builtins fix

Using NodeJS, as is today, will still show many missing lines in the stack. I did those tests, and could do a useful analysis, because I applied a very recent patch I landed in V8.

Before the fix, we would have this sequence:

  • Enable ETW recording
  • Run several NodeJS tests.
  • Each of the tests creates one or more JS contexts.
  • That context then sends to ETW the information of any code compiled with JIT.

But there was a problem: any JS context has already a lot of pre-compiled code associated: builtins and V8 snapshot code. Those were missing from the ETW traces captured.

The fix, as said, has been already landed to V8, and hopefully will be available soon in future NodeJS releases.

Wrapping up

There is more work to do:

  • WASM is still not supported.
  • Ideally, we would want to have --enable-etw-stack-walking set by default, as the impact while not tracing is minimal.

In any case, after these new fixes, capturing ETW stack walks of code executed by NodeJS runtime is a bit easier. I hope this gives some joy to your performance research.

One last thing! My work for these fixes is possible thanks to the sponsorship from Igalia and Bloomberg.

Native call stack profiling (3/3): 2022 work in V8

This is the last blog post of the series. In first post I presented some concepts of call stack profiling, and why it is useful. In second post I reviewed Event Tracing for Windows, the native tool for the purpose, and how it can be used to trace Chromium.

This last post will review the work done in 2022 to improve the support in V8 of call stack profiling in Windows.

I worked on several of the fixes this year. This work has been sponsored by Bloomberg and Igalia.

This work was presented as a lightning talk in BlinkOn 17.

Some bad news to start… and a fix

In March I started working on the report that Windows event traces where not properly resolving the Javascript symbols.

After some bisecting I found this was a regression introduced by this commit, that changed the --js-flags handling to a later stage. This happened to be after V8 initialization, so the code that would enable instrumentation would not consider the flag.

The fix I implemented moved flags processing to happen right before platform initialization, so instrumentation worked again.

Simplified method names

Another fix I worked was to improve the methods name generation. Windows tracing would show a quite redundant description of each level, and that was making analysis more difficult.

Before my work, the entries would look like this:

string-tagcloud.js!LazyCompile:~makeTagCloud- string-tagcloud.js:231-232:22 0x0

After my change, now it looks like this:

string-tagcloud.js!makeTagCloud-231:22 0x0

The fix adds a specific implementation for ETW. Instead of reusing the method name that is also used for Perf, it has a specific implementation for function that takes into account what ETW backend exports already, to avoid redundancy. It also takes advantage of the existing method DebugNameCStr to retrieve inferred method names in case there is no name available.

Problem with Javascript code compiled before tracing

The way V8 ETW worked was that, when tracing was ongoing and a new function was compiled in JIT, it would emit information to ETW.

This implied a big problem. If a function was compiled by V8 before tracing started, then ETW would not properly resolve the function names so, when analyzing the traces, it would not be possible to know which function was called at any of the samples.

The solution is conceptually simple. When tracing starts, V8 traverse the living Javascript contexts and emit all the symbols. This adds noise to the tracing, as it is an expensive process. But, as it happens at the start of the tracing, it is very easy to isolate in the captured trace.

And a performance fix

I also fixed a huge performance penalty when tracing code from snapshots, caused by calculating all the time the end line numbers of code instead of caching it.

Initialization improvements

Paolo Severini improved the initialization code, so the initialization of an ETW session was lighter, and also tracing would be started or stopped correctly.

Benchmarking ETW overhead

After all these changes I did some benchmarking with and without ETW. The goal was knowing if it would be good to enable by default ETW support in V8, not requiring to pass any JS flag.

With Sunspider in a Windows 64 bits build:

Image showing slight overhead with ETW and bigger one with interpreted frames.

Other benchmarks I tried gave similar numbers.

So far, in 64 bits architecture I could not detect any overhead of enabling ETW support when recording is not happening, and the cost when it is enabled is very low.

Though, when combined with interpreted frames native stack, the overhead is close to 10%. This was expected as explained here.

So, good news so far. We still need to benchmark 32 bit architecture to see if the impact is similar.

Try it!

The work described in this post is available in V8 10.9.0. I hope you enjoy the improvements, and specially hope these tools help in the investigation of performance issues around Javascript, in NodeJS, Google Chrome or Microsoft Edge.

What next?

There is still a lot of things to do, and I hope I can continue working on improvements for V8 ETW support next year:

  • First, finishing the benchmarks, and considering to enable ETW instrumentation by default in V8 and derivatives.
  • Add full support for WASM.
  • Bugfixing, as we still see segments missing in certain benchnarmks.
  • Create specific events for when the JIT information of already compiled symbols is sent to ETW, to make it easier to differenciate from the code compiled while recording a trace.

If you want to track the work, keep an eye on V8 issue 11043.

The end

This is the last post in the series.

Thanks to Bloomberg and Igalia for sponsoring my work in ETW Chromium integration improvements!

Native call stack profiling (2/3): Event Tracing for Windows and Chromium

In last blog post, I introduced call stack profiling, why it is useful, and how a system wide support can be useful. This new blog post will talk about Windows native call stack tracing, and how it is integrated in Chromium.

Event Tracing for Windows (ETW)

Event Tracing for Windows, usually also named with the acronym ETW, is a Windows kernel based tool that allows to log kernel and application events to a file.

A good description of its architecture is available at Microsoft Learn: About Event Tracing.

Essentially, it is an efficient event capturing tool, in some ways similar to LTTng. Its events recording stage is as lightweight as possible to avoid processing of collected data impacting the results as much as possible, reducing the observer effect.

The main participants are:
– Providers: kernel components (including device drivers) or applications that emit log events.
– Controllers: tools that control when a recording session starts and stops, which providers to record, and what each provider is expected to log. Controllers also decide where to dump the recorded data (typically a file).
– Consumers: tools that can read and analyze the recorded data, and combine with system information (i.e. debugging information). Consumers will usually get the data from previously recorded files, but it is also possible to consume tracing information in real time.

What about call stack profiling? ETW supports call stack sampling, allowing to capture call stacks when certain events happen, and associates the call stack to that event. Bruce Dawson has written a fantastic blog post about the topic.

Chromium call stack profiling in Windows

Chromium provides support for call stack profiling. This is done at different levels of the stack:
– It allows to build with frame pointers, so CPU profile samplers can properly capture the full call stack.
– v8 can generate symbol information for for JIT-compiled code. This is supported for ETW (and also for Linux Perf).

Compilation

In any platform compilation will usually benefit from compiling with the GN flag enable_profiling=true. This will enable frame pointers support. In Windows, it will also enable generation of function information for code generated by V8.

Also, symbol_level=1 should be added at least, so the compilation stage function names are available.

Chrome startup

To enable generation of V8 profiling information in Windows, these flags should be passed to chrome on launch:

chrome --js-flags="--enable-etw-stack-walking --interpreted-frames-native-stack"

--enable-etw-stack-walking will emit information of the functions compiled by V8 JIT engine, so they can be recorded while sampling the stack.

--interpreted-frames-native-stack will show the frames of interpreted code in the native stack, so external profilers as ETW can properly show those in the profiling samples.

Recording

Then, a session of the workload to analyze can be captured with Windows Performance Recorder.

An alternate tool with specific Chromium support, UIForETW can be used too. Main advantage is that it allows to select specific Chromium tracer categories, that will be emitted in the same trace. Its author, Bruce Dawson, has explained very well how to use it.

Analysis

For analysis, the tool Windows Performance Analyzer (WPA) can be used. Both UIForETW and Windows Performance Recorder will offer opening the obtained trace at the end of the capture for analysis.

Before starting analysis, in WPA, add the paths where the .PDB files with debugging information are available.

Then, select Computation/CPU Usage (Sampled):

.

From the available charts, we are interested in the ones providing stackwalk information:

Next

In the last post of this series, I will present the work done in 2022 to improve V8 support for Windows ETW.

Native call stack profiling (1/3): introduction

This week I presented a lightning talk in BlinkOn 17. There I talked about the work for improving native stack profiling support
in Windows.

This post starts a series where I will provide more context and details
to the presentation.

Why callstack profiling

First, a definition:

Callstack profiling: a performance analysis tool, that samples periodically the call stacks of all threads, for a specific workload.

Why is it useful? It provides a better undestanding of performance problems, specially if they are caused by CPU-bound bottle necks.

As we sample the full stack for each thread, we are capturing a handful of information:
– Which functions are using more CPU directly.
– As we capture the full stacktrace, we know also which functions involve more CPU usage, even if it is indirectly through the calls they do.

But it is not only useful for CPU waits. It will also capture when a method is waiting for something (i.e. because of networking, or a semaphore).

The provided information is useful for initial analysis of the problem, as it will give a high level view of where time could be spent by the application. But it will also be useful in further stages of the analysis, and even for comparing different implementations and consider possible changes.

How does it work?

For call stack sampling, we need some infrastructure to be able to capture and traverse properly the callstack for each thread.

In compilation stage, information is added for function names and the frame pointers. This allows, for a specific stack, to resolve later the actual names, and even lines of code that are captured.

In runtime stage, function information will be required for generated code. I.e. in a web browser, the Javascript code that is compiled in runtime.

Then, every sample will extract the callstack of all the threads of all the analysed processes. This will happen periodically, at the rate established by the profiling tool.

System wide native callstack profiling

When possible, sampling the call stacks of the full system can be benefitial for the analysis.

First, we may want to include system libraries and other dependencies of our component in the analysis. But also, system analyzers can provide other metrics that can give a better context to the analysed workload (network or CPU load, memory usage, swappiness, …).

In the end, many problems are not bound to a single component, so capturing the interaction with other components can be useful.

Next

In next blog posts in this series, I will present native stack profiling for Windows, and how it is integrated with Chromium.

3 events in a month

As part of my job at Igalia, I have been attending 2-3 events per year. My role mostly as a Chromium stack engineer is not usually much demanding regarding conference trips, but they are quite important as an opportunity to meet collaborators and project mates.

This month has been a bit different, as I ended up visiting Santa Clara LG Silicon Valley Lab in California, Igalia headquarters in A Coruña, and Dresden. It was mostly because I got involved in the discussions for the web runtime implementation being developed by Igalia for AGL.

AGL f2f at LGSVL

It is always great to visit LG Silicon Valley Lab (Santa Clara, US), where my team is located. I have been participating for 6 years in the development of the webOS web stack you can most prominently enjoy in LG webOS smart TV.

One of the goals for next months at AGL is providing an efficient web runtime. In LGSVL we have been developing and maintaining WAM, the webOS web runtime. And as it was released with an open source license in webOS Open Source Edition, it looked like a great match for AGL. So my team did a proof of concept in May and it was succesful. At the same time Igalia has been working on porting Chromium browser to AGL. So, after some discussions AGL approved sponsoring my company, Igalia for porting the LG webOS web runtime to AGL.

As LGSVL was hosting the september 2018 AGL f2f meeting, Igalia sponsored my trip to the event.

AGL f2f Santa Clara 2018, AGL wiki CC BY 4.0

So we took the opportunity to continue discussions and progress in the development of the WAM AGL port. And, as we expected, it was quite beneficial to unblock tasks like AGL app framework security integration, and the support of AGL latest official release, Funky Flounder. Julie Kim from Igalia attended the event too, and presented an update on the progress of the Ozone Wayland port.

The organization and the venue were great. Thanks to LGSVL!

Web Engines Hackfest 2018 at Igalia

Next trip was definitely closer. Just 90 minutes drive to our Igalia headquarters in A Coruña.


Igalia has been organizing this event since 2009. It is a cross-web-engine event, where engineers of Mozilla, Chromium and WebKit have been meeting yearly to do some hacking, and discuss the future of the web.

This time my main interest was participating in the discussions about the effort by Igalia and Google to support Wayland natively in Chromium. I was pleased to know around 90% of the work had already landed in upstream Chromium. Great news as it will smooth integration of Chromium for embedders using Ozone Wayland, like webOS. It was also great to know the work for improving GPU performance reducing the number of copies required for painting web contents.

Web Engines Hackfest 2018 CC BY-SA 2.0

Other topics of my interest:
– We did a follow-up of the discussion in last BlinkOn about the barriers for Chromium embedders, sharing the experiences maintaining a downstream Chromium tree.
– Joined the discussions about the future of WebKitGTK. In particular the graphics pipeline adaptation to the upcoming GTK+ 4.

As usual, the organization was great. We had 70 people in the event, and it was awesome to see all the activity in the office, and so many talented engineers in the same place. Thanks Igalia!

Web Engines Hackfest 2018 CC BY-SA 2.0

AGL All Members Meeting Europe 2018 at Dresden

The last event in barely a month was my first visit to the beautiful town of Dresden (Germany).

The goal was continuing the discussions for the projects Igalia is developing for AGL platform: Chromium upstream native Wayland support, and the WAM web runtime port. We also had a booth showcasing that work, but also our lightweight WebKit port WPE that was, as usual, attracting interest with its 60fps video playback performance in a Raspberry Pi 2.

I co-presented with Steve Lemke a talk about the automotive activities at LGSVL, taking the opportunity to update on the status of the WAM web runtime work for AGL (slides here). The project is progressing and Igalia should be landing soon the first results of the work.

Igalia booth at AGL AMM Europe 2018

It was great to meet all this people, and discuss in person the architecture proposal for the web runtime, unblocking several tasks and offering more detailed planning for next months.

Dresden was great, and I can’t help highlighting the reception and guided tour in the Dresden Transportation Museum. Great choice by the organization. Thanks to Linux Foundation and the AGL project community!

Next: Chrome Dev Summit 2018

So… what’s next? I will be visiting San Francisco in November for Chrome Dev Summit.

I can only thank Igalia for sponsoring my attendance to these events. They are quite important for keeping things moving forward. But also, it is also really nice to meet friends and collaborators. Thanks Igalia!