In last blog post, I introduced call stack profiling, why it is useful, and how a system wide support can be useful. This new blog post will talk about Windows native call stack tracing, and how it is integrated in Chromium.
Event Tracing for Windows (ETW) #
Event Tracing for Windows, usually also named with the acronym ETW, is a Windows kernel based tool that allows to log kernel and application events to a file.
A good description of its architecture is available at Microsoft Learn: About Event Tracing.
Essentially, it is an efficient event capturing tool, in some ways similar to LTTng. Its events recording stage is as lightweight as possible to avoid processing of collected data impacting the results as much as possible, reducing the observer effect.
The main participants are:
- Providers: kernel components (including device drivers) or applications that emit log events.
- Controllers: tools that control when a recording session starts and stops, which providers to record, and what each provider is expected to log. Controllers also decide where to dump the recorded data (typically a file).
- Consumers: tools that can read and analyze the recorded data, and combine with system information (i.e. debugging information). Consumers will usually get the data from previously recorded files, but it is also possible to consume tracing information in real time.
What about call stack profiling? ETW supports call stack sampling, allowing to capture call stacks when certain events happen, and associates the call stack to that event. Bruce Dawson has written a fantastic blog post about the topic.
Chromium call stack profiling in Windows #
Chromium provides support for call stack profiling. This is done at different levels of the stack:
- It allows to build with frame pointers, so CPU profile samplers can properly capture the full call stack.
- v8 can generate symbol information for for JIT-compiled code. This is supported for ETW (and also for Linux Perf).
Compilation #
In any platform compilation will usually benefit from compiling with the GN flag enable_profiling=true. This will enable frame pointers support. In Windows, it will also enable generation of function information for code generated by V8.
Also, symbol_level=1 should be added at least, so the compilation stage function names are available.
Chrome startup #
To enable generation of V8 profiling information in Windows, these flags should be passed to chrome on launch:
chrome --js-flags="--enable-etw-stack-walking --interpreted-frames-native-stack"--enable-etw-stack-walking will emit information of the functions compiled by V8 JIT engine, so they can be recorded while sampling the stack.
--interpreted-frames-native-stack will show the frames of interpreted code in the native stack, so external profilers as ETW can properly show those in the profiling samples.
Recording #
Then, a session of the workload to analyze can be captured with Windows Performance Recorder.
An alternate tool with specific Chromium support, UIForETW can be used too. Main advantage is that it allows to select specific Chromium tracer categories, that will be emitted in the same trace. Its author, Bruce Dawson, has explained very well how to use it.
Analysis #
For analysis, the tool Windows Performance Analyzer (WPA) can be used. Both UIForETW and Windows Performance Recorder will offer opening the obtained trace at the end of the capture for analysis.
Before starting analysis, in WPA, add the paths where the .PDB files with debugging information are available.
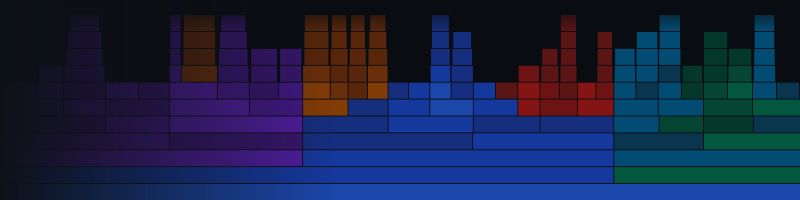
Then, select Computation/CPU Usage (Sampled):
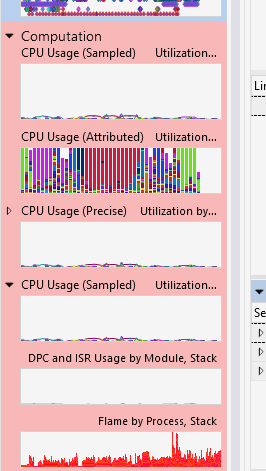

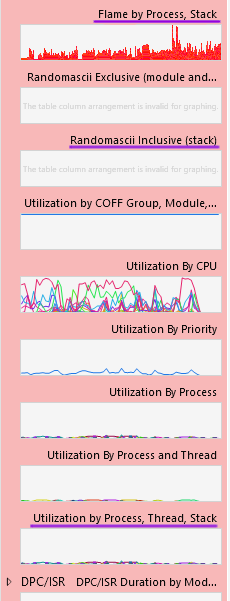
From the available charts, we are interested in the ones providing stackwalk information:
Next #
In the last post of this series, I will present the work done in 2022 to improve V8 support for Windows ETW.