Last year I wrote a series of blog posts (1, 2, 3) about stack walk profiling Chromium using Windows native tools around ETW.
A fast recap: ETW support for stack walking in V8 allows to show V8 JIT generated code in the Windows Performance Analyzer. This is a powerful tool to analyze work loads where Javascript execution time is significant.
In this blog post, I will cover the usage of this very same tool, but to analyze NodeJS execution.
Enabling stack walk JIT information in NodeJS
In an ideal situation, V8 engines would always generate stack walk information when Windows is profiling. This is something we will want to consider in the future, as we prove enabling it has no cost if we are not in a tracing session.
Meanwhile, we need to set the V8 flag --enable-etw-stack-walking somehow. This will install hooks that, when a profiling session starts, will emit the JIT generated code addresses, and the information about the source code associated to them.
For a command line execution of NodeJS runtime, it is as simple as passing the command line flag:
node --enable-etw-stack-walking
This will work enabling ETW stack walking for that specific NodeJS session… Good, but not very useful.
Enabling ETW stack walking for a session
What’s the problem here? Usually, NodeJS is invoked indirectly through other tools (based or not in NodeJS). Some examples are Yarn, NPM, or even some Windows scripts or link files.
We could tune all the existing launching scripts to pass --enable-etw-stack-walking to the NodeJS runtime when it is called. But that is not much convenient.
There is a better way though, just using NODE_OPTIONS environment variable. This way, stack walking support can be enabled for all NodeJS calls in a shell session, or even system wide.
Bad news and good news
Some bad news: NodeJS was refusing --enable-etw-stack-walking in NODE_OPTIONS. There is a filter for which V8 options it accepts (mostly for security purposes), and ETW support was not considered.
Good news? I implemented a fix adding the flag to the list accepted by NODE_OPTIONS. It has been landed already, and it is available from NodeJS 19.6.0. Unfortunately, if you are using an older version, then you may need to backport the patch.
Using it: linting TypeScript
To explain how this can be used, I will analyse ESLint on a known workload: TypeScript. For simplicity, we are using the lint task provided by TypeScript.
This example assumes the usage of Git Bash.
First, clone TypeScript from GitHub, and go to the cloned copy:
git clone https://github.com/microsoft/TypeScript.git
cd TypeScript
Then, install hereby and the dependencies of TypeScript:
npm install -g hereby
npm ci
Now, we are ready to profile the lint task. First, set NODE_OPTIONS:
export NODE_OPTIONS="--enable-etw-stack-walking"
Then, launch UIForETW. This tool simplifies capturing traces, and will provide good defaults for Javascript ETW analysis. It provides a very useful keyboard shortcut, <Ctrl>+<Win>+R, to start and then stop a recording.
Switch to Git Bash terminal and do this sequence:
- Write (without pressing <Enter>):
hereby lint - Press <Ctrl>+<Win>+R to start recording. Wait 3-4 seconds as recording does not start immediately.
- Press <Enter>. ESLint will traverse all the TypeScript code.
- Press again <Ctrl>+<Win>+R to stop recording.
After a few seconds UIForETW will automatically open the trace in Windows Performance Analyzer. Thanks to settings NODE_OPTIONS all the child processes of the parent node.exe execution also have stack walk information.
Randomascii inclusive (stack) analysis
Focusing on node.exe instances, in Randomascii inclusive (stack) view, we can see where time is spent for each of the node.exe processes. If I take the bigger one (that is the longest of the benchmarks I executed), I get some nice insights.
The worker threads take 40% of the CPU processing. What is happening there? I basically see JIT compilation and garbage collection concurrent marking. V8 offloads that work, so there is a benefit from a multicore machine.
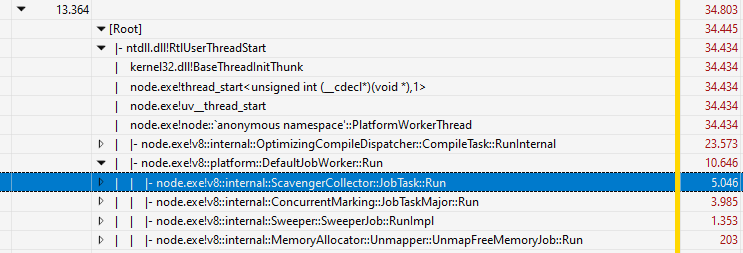
Most of the work happens in the main thread, as expected. And most of the time is spent parsing and applying the lint rules (half for each).
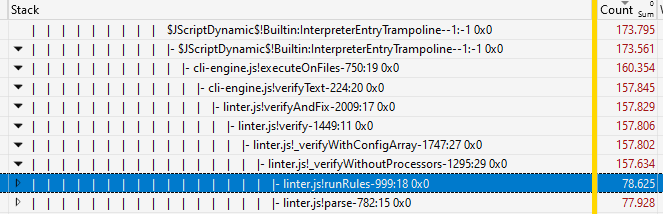
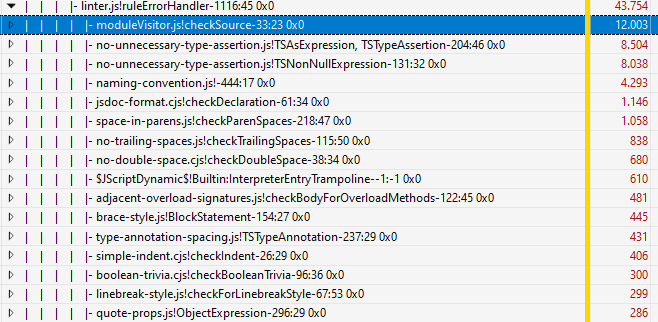
If we go deeper in the rules processing, we can see which rules are more expensive.
Memory allocation
In total commit view, we can observe the memory usage pattern of the process running ESLint. For most of the seconds of the workload, allocation grows steadily (to over 2GB of RAM). Then there is a first garbage collection, and a bit later, the process finishes and all the memory is deallocated.

More findings
At first sight, I observe we are creating the rules objects for all the execution of ESLint. What does it mean? Could we run faster reusing those? I can also observe that a big part of the time in main thread leads to leaves doing garbage collection.
This is a good start! You can see how ETW can give you insights of what is happening and how much time it takes. And even correlate that to memory usage, File I/O, etc.
Builtins fix
Using NodeJS, as is today, will still show many missing lines in the stack. I did those tests, and could do a useful analysis, because I applied a very recent patch I landed in V8.
Before the fix, we would have this sequence:
- Enable ETW recording
- Run several NodeJS tests.
- Each of the tests creates one or more JS contexts.
- That context then sends to ETW the information of any code compiled with JIT.
But there was a problem: any JS context has already a lot of pre-compiled code associated: builtins and V8 snapshot code. Those were missing from the ETW traces captured.
The fix, as said, has been already landed to V8, and hopefully will be available soon in future NodeJS releases.
Wrapping up
There is more work to do:
- WASM is still not supported.
- Ideally, we would want to have
--enable-etw-stack-walkingset by default, as the impact while not tracing is minimal.
In any case, after these new fixes, capturing ETW stack walks of code executed by NodeJS runtime is a bit easier. I hope this gives some joy to your performance research.
One last thing! My work for these fixes is possible thanks to the sponsorship from Igalia and Bloomberg.