Maintaining Chromium downstream: update strategies

This is the second of a series of blog posts I am publishing for sharing some considerations about the challenges of maintaining a downstream of Chromium.

The first part, Maintaining downstreams of Chromium: why downstreams?, provided initial definitions, and an analysis of why someone would need to maintain a downstream.

In this post I will focus on the possible different strategies for tracking the Chromium upstream project changes, and integrating the downstream changes.

Applying changes

The first problem is related to the fact that our downstream will include additional changes on top of upstream (otherwise we would not need a downstream, right?).

There are two different approaches for this, based on the Git strategy used: rebase vs. merge.

Merge strategy

This consists on maintaining an upstream branch and periodically merging its changes to the downstream branch.

In the case of Chromium, the size of the repository and the amount and frequency of the changes is really big, so the chances that merging changes cause any conflict are higher than in other smaller projects.

Rebase strategy

This consists on maintaining the downstream changes as a series of patches, that are applied on top of an upstream baseline.

Updating means changing the baseline and applying all the patches. As this is done, not all patches will cause a conflict. And, for the ones that do, the complexity is far smaller.

Tip: keep the downstream as small as possible

Don’t hesitate to remove features that are more prone to cause conflicts. And at least, think carefully, for each change, if it can be done in a way that matches better upstream codebase.

And, if some of your changes are good for the commons, just contribute them to upstream!

When to update?

A critical aspect of applying upstream changes is how often to do that.

The size and structure of the team involved is highly dependent on this decision. And of course, planning the resources.

Usually this needs to be as much predictable as possible, and bound to the upstream release cycle.

Some examples used in downstream projects:

  • Weekly or daily tracking.
  • Major releases.

Upstream release policy and rebases

It is not only important how often you track upstream repository, but also what you track.

Chromium, nowadays, follows this procedure for each major release (first number in the version):

  • Main development happens in main branch. Several releases are tagged daily. And, mostly every week, one of them is released to the dev channel for users to try (with additional testing).
  • At a point, an stabilization branch is created, entering beta stage. The quality bar for what is landed in this branch is raised. Only stabilization work is done. More releases per day are tagged, and again, approximately once per week one is released to beta channel.
  • When planned, the branch becomes stable. This means it is ready for wide user adoption, so the stable channel will pick its releases from this branch.

That means main (development branch) targets version N, then N-1 branch is the beta (or stabilization branch), and N-2 is the stable branch. Nowadays Chromium targets publishing a new major stable version every four weeks (and that also means a release spends 4 weeks in beta channel).

You can read the official release cycle documentation if you want to know more, including the extended stable (or long term support) channel.

Some downstreams will track upstream main branch. Some others will just start applying the downstream changes when first release lands the stable channel. And some may just start when main is branched and stabilization work begins.

Tip: update often

The more you update, the smaller the change set you need to consider. And that means reducing the complexity of the changes.

This is specially important when merging instead of rebasing, as applying the new changes is done in one step.

This could be hard, though, depending on the size of the downstream. And, from time to time some refactors upstream will still imply non-trivial work to adapt the downstream changes.

Tip: update NOT so often

OK, OK. I just told the opposite, right?

Now, think of a complex change upstream, that implies many intermediate steps, with a moving architecture that evolves as it is developed (something not unfrequent in Chromium). Updating often means you will need to adapt your downstream to all the intermediate steps.

That definitely could mean more work.

A nice strategy for matching upstream stable releases

If you want to publish an stable release almost the same day or week of the official upstream stable release, and your downstream changes are not trivial, then a good moment for starting applying changes is when the stabilization branch happens.

But the first days there is a lot of stabilization work happening, as the quality bar is raised. So… waiting a few days after the beta branch happens could be a good idea.

An idea: just wait for the second version published in beta channel (the first one happens right after branching). That should give still three full weeks before the version is promoted to the stable channel.

Tracking main branch: automate everything!

In case you want to follow upstream main branch, in a daily basis (or even per commit), then it is just not practical to do that manually.

The solution for that is automation, at different levels:

  • Applying the changes.
  • Resolving the conflicts.
  • And, more important, testing the result is working.

Good automation is, though, expensive. It requires computing power for building Chromium often, and run tests. But, increasing test coverage will detect issues earlier, and give an extra margin for resolving them.

In any case, no matter your update strategy is, automation will always be helpful.

Next

This is the end of the post. So, what comes next?

In the next post in this series, I will talk about the downstream size problem, and different approaches for keeping it under control.
References

Stack walk profiling NodeJS in Windows

Last year I wrote a series of blog posts (1, 2, 3) about stack walk profiling Chromium using Windows native tools around ETW.

A fast recap: ETW support for stack walking in V8 allows to show V8 JIT generated code in the Windows Performance Analyzer. This is a powerful tool to analyze work loads where Javascript execution time is significant.

In this blog post, I will cover the usage of this very same tool, but to analyze NodeJS execution.

Enabling stack walk JIT information in NodeJS

In an ideal situation, V8 engines would always generate stack walk information when Windows is profiling. This is something we will want to consider in the future, as we prove enabling it has no cost if we are not in a tracing session.

Meanwhile, we need to set the V8 flag --enable-etw-stack-walking somehow. This will install hooks that, when a profiling session starts, will emit the JIT generated code addresses, and the information about the source code associated to them.

For a command line execution of NodeJS runtime, it is as simple as passing the command line flag:

node --enable-etw-stack-walking

This will work enabling ETW stack walking for that specific NodeJS session… Good, but not very useful.

Enabling ETW stack walking for a session

What’s the problem here? Usually, NodeJS is invoked indirectly through other tools (based or not in NodeJS). Some examples are Yarn, NPM, or even some Windows scripts or link files.

We could tune all the existing launching scripts to pass --enable-etw-stack-walking to the NodeJS runtime when it is called. But that is not much convenient.

There is a better way though, just using NODE_OPTIONS environment variable. This way, stack walking support can be enabled for all NodeJS calls in a shell session, or even system wide.

Bad news and good news

Some bad news: NodeJS was refusing --enable-etw-stack-walking in NODE_OPTIONS. There is a filter for which V8 options it accepts (mostly for security purposes), and ETW support was not considered.

Good news? I implemented a fix adding the flag to the list accepted by NODE_OPTIONS. It has been landed already, and it is available from NodeJS 19.6.0. Unfortunately, if you are using an older version, then you may need to backport the patch.

Using it: linting TypeScript

To explain how this can be used, I will analyse ESLint on a known workload: TypeScript. For simplicity, we are using the lint task provided by TypeScript.

This example assumes the usage of Git Bash.

First, clone TypeScript from GitHub, and go to the cloned copy:

git clone https://github.com/microsoft/TypeScript.git
cd TypeScript

Then, install hereby and the dependencies of TypeScript:

npm install -g hereby
npm ci

Now, we are ready to profile the lint task. First, set NODE_OPTIONS:

export NODE_OPTIONS="--enable-etw-stack-walking"

Then, launch UIForETW. This tool simplifies capturing traces, and will provide good defaults for Javascript ETW analysis. It provides a very useful keyboard shortcut, <Ctrl>+<Win>+R, to start and then stop a recording.

Switch to Git Bash terminal and do this sequence:

  • Write (without pressing <Enter>): hereby lint
  • Press <Ctrl>+<Win>+R to start recording. Wait 3-4 seconds as recording does not start immediately.
  • Press <Enter>. ESLint will traverse all the TypeScript code.
  • Press again <Ctrl>+<Win>+R to stop recording.

After a few seconds UIForETW will automatically open the trace in Windows Performance Analyzer. Thanks to settings NODE_OPTIONS all the child processes of the parent node.exe execution also have stack walk information.

Randomascii inclusive (stack) analysis

Focusing on node.exe instances, in Randomascii inclusive (stack) view, we can see where time is spent for each of the node.exe processes. If I take the bigger one (that is the longest of the benchmarks I executed), I get some nice insights.

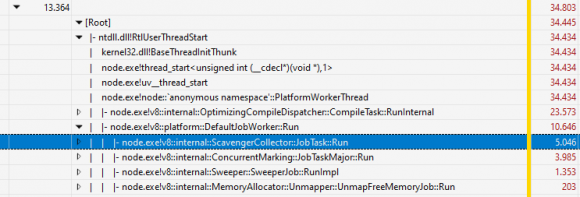
The worker threads take 40% of the CPU processing. What is happening there? I basically see JIT compilation and garbage collection concurrent marking. V8 offloads that work, so there is a benefit from a multicore machine.

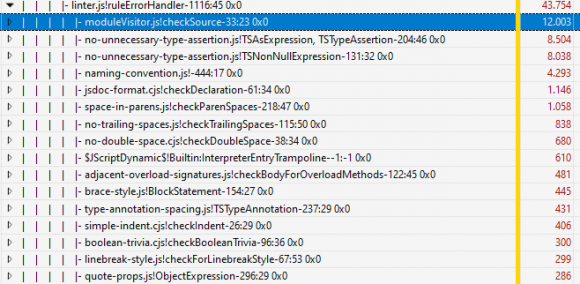
Most of the work happens in the main thread, as expected. And most of the time is spent parsing and applying the lint rules (half for each).

If we go deeper in the rules processing, we can see which rules are more expensive.

Memory allocation

In total commit view, we can observe the memory usage pattern of the process running ESLint. For most of the seconds of the workload, allocation grows steadily (to over 2GB of RAM). Then there is a first garbage collection, and a bit later, the process finishes and all the memory is deallocated.

More findings

At first sight, I observe we are creating the rules objects for all the execution of ESLint. What does it mean? Could we run faster reusing those? I can also observe that a big part of the time in main thread leads to leaves doing garbage collection.

This is a good start! You can see how ETW can give you insights of what is happening and how much time it takes. And even correlate that to memory usage, File I/O, etc.

Builtins fix

Using NodeJS, as is today, will still show many missing lines in the stack. I did those tests, and could do a useful analysis, because I applied a very recent patch I landed in V8.

Before the fix, we would have this sequence:

  • Enable ETW recording
  • Run several NodeJS tests.
  • Each of the tests creates one or more JS contexts.
  • That context then sends to ETW the information of any code compiled with JIT.

But there was a problem: any JS context has already a lot of pre-compiled code associated: builtins and V8 snapshot code. Those were missing from the ETW traces captured.

The fix, as said, has been already landed to V8, and hopefully will be available soon in future NodeJS releases.

Wrapping up

There is more work to do:

  • WASM is still not supported.
  • Ideally, we would want to have --enable-etw-stack-walking set by default, as the impact while not tracing is minimal.

In any case, after these new fixes, capturing ETW stack walks of code executed by NodeJS runtime is a bit easier. I hope this gives some joy to your performance research.

One last thing! My work for these fixes is possible thanks to the sponsorship from Igalia and Bloomberg.

Updated Chromium Legacy Wayland Support

Introduction

Future Ozone Wayland backend is still not ready for shipping. So we are announcing the release of an updated Ozone Wayland backend for Chromium, based on the implementation provided by Intel. It is rebased on top of latest stable Chromium release and you can find it in my team Github. Hope you will appreciate it.

Official Chromium on Linux desktop nowadays

Linux desktop is progressively migrating to use Wayland as the display server. It is the default option in Fedora, Ubuntu ~~and, more importantly, the next Ubuntu Long Term Support release will ship Gnome Shell Wayland display server by default~~ (P.S. since this post was originally written, Ubuntu has delayed the Wayland adoption for LTS).

As is, now, Chromium browser for Linux desktop support is based on X11. This means it will natively interact with an X server and with its XDG extensions for displaying the contents and receiving user events. But, as said, next generation of Linux desktop will be using Wayland display servers instead of X11. How is it working? Using XWayland server, a full X11 server built on top of Wayland protocol. Ok, but that has an impact on performance. Chromium needs to communicate and paint to X11 provided buffers, and then, those buffers need to be shared with Wayland display server. And the user events will need to be proxied from the Wayland display server through the XWayland server and X11 protocol. It requires more resources: more memory, CPU, and GPU. And it adds more latency to the communication.

Ozone

Chromium supports officially several platforms (Windows, Android, Linux desktop, iOS). But it provides abstractions for porting it to other platforms.

The set of abstractions is named Ozone (more info here). It allows to implement one or more platform components with the hooks for properly integrating with a platform that is in the set of officially supported targets. Among other things it provides abstractions for:
* Obtaining accelerated surfaces.
* Creating and obtaining windows to paint the contents.
* Interacting with the desktop cursor.
* Receiving user events.
* Interacting with the window manager.

Chromium and Wayland (2014-2016)

Even if Wayland was not used on Linux desktop, a bunch of embedded devices have been using Wayland for their display server for quite some time. LG has been shipping a full Wayland experience on the webOS TV products.

In the last 4 years, Intel has been providing an implementation of Ozone abstractions for Wayland. It was an amazing work that allowed running Chromium browser on top of a Wayland compositor. This backend has been the de facto standard for running Chromium browser on all these Wayland-enabled embedded devices.

But the development of this implementation has mostly stopped around Chromium 49 (though rebases on top of Chromium 51 and 53 have been provided).

Chromium and Wayland (2018+)

Since the end of 2016, Igalia has been involved on several initiatives to allow Chromium to run natively in Wayland. Even if this work is based on the original Ozone Wayland backend by Intel, it is mostly a rewrite and adaptation to the future graphics architecture in Chromium (Viz and Mus).

This is being developed in the Igalia GitHub, downstream, though it is expected to be landed upstream progressively. Hopefully, at some point in 2018, this new backend will be fully ready for shipping products with it. But we are still not there. ~~Some major missing parts are Wayland TextInput protocol and content shell support~~ (P.S. since this was written, both TextInput and content shell support are working now!).

More information on these posts from the authors:
* June 2016: Understanding Chromium’s runtime ozone platform selection (by Antonio Gomes).
* October 2016: Analysis of Ozone Wayland (by Frédéric Wang).
* November 2016: Chromium, ozone, wayland and beyond (by Antonio Gomes).
* December 2016: Chromium on R-Car M3 & AGL/Wayland (by Frédéric Wang).
* February 2017: Mus Window System (by Frédéric Wang).
* May 2017: Chromium Mus/Ozone update (H1/2017): wayland, x11 (by Antonio Gomes).
* June 2017: Running Chromium m60 on R-Car M3 board & AGL/Wayland (by Maksim Sisov).

Releasing legacy Ozone Wayland backend (2017-2018)

Ok, so new Wayland backend is still not ready in some cases, and the old one is unmaintained. For that reason, LG is announcing the release of an updated legacy Ozone Wayland backend. It is essentially the original Intel backend, but ported to current Chromium stable.

Why? Because we want to provide a migration path to the future Ozone Wayland backend. And because we want to share this effort with other developers, willing to run Chromium in Wayland immediately, or that are still using the old backend and cannot immediately migrate to the new one.

WARNING If you are starting development for a product that is going to happen in 1-2 years… Very likely your best option is already migrating now to the new Ozone Wayland backend (and help with the missing bits). We will stop maintaining it ourselves once new Ozone Wayland backend lands upstream and covers all our needs.

What does this port include?
* Rebased on top of Chromium m60, m61, m62 and m63.
* Ported to GN.
* It already includes some changes to adapt to the new Ozone Wayland refactors.

It is hosted at https://github.com/lgsvl/chromium-src.

Enjoy it!

Originally published at webOS Open Source Edition Blog. and licensed under Creative Commons Attribution 4.0.