Let me talk here about how we implemented the support for performance counters in the Mesa V3D driver, the OpenGL driver used by the Raspberry Pi 4. For reference, the implementation is very similar to the one already available (not done by me, by the way) for the VC4, OpenGL driver for the Raspberry Pi 3 and prior devices, also part of Mesa. If you are already familiar with how this is implemented in VC4, then this will mostly be a refresher.
First of all, what are these performance counters? Most of the processors nowadays contain some hardware facilities to get measurements about what is happening inside the processor. And of course graphics processors aren’t different. In this case, the graphics chips used by Raspberry Pi devices (manufactured by Broadcom) can record a bunch of different graphics-related parameters: how many quads are passing or failing depth/stencil tests, how many clock cycles are spent on doing vertex/fragment shading, hits/misses in the GPU cache, and many others values. In fact, with the V3D driver it is possible to measure around 87 different parameters, and up to 32 of them simultaneously. Quite a few less in VC4, though. But still a lot.
On a hardware level, using these counters is just a matter of writing and reading some GPU registers. First, write the registers to select what we want to measure, then a few more to start to measure, and finally read other registers containing the results. But of course, much like we don’t expect users to write GPU assembly code, we don’t expect users to write registers in the GPU directly. Moreover, even the Mesa drivers such as V3D can’t interact directly with the hardware; rather, this is done through the kernel, the one that can use the hardware directly, through the DRM subsystem in the kernel. For the case of V3D (and same applies to VC4, and in general to any other driver), we have a driver in user-space (whether the OpenGL driver, V3D, or the Vulkan driver, V3DV), and a kernel driver in the kernel-space, unsurprisingly also called V3D. The user-space driver is in charge of translating all the commands and options created with the OpenGL API or other API to batches of commands to be executed by the GPU, which are submitted to the kernel driver as DRM jobs. The kernel does the proper actions to send these to the GPU to execute them, including touching the proper registers. Thus, if we want to implement support for the performance counters, we need to modify the code in two places: the kernel and the (user-space) driver.
Implementation in the kernel
Here we need to think about how to deal with the GPU and the registers to make the performance counters work, as well as the API we provide to user-space to use them. As mentioned before, the approach we are following here is the same as the one used in the VC4 driver: performance counters monitors. That is, the user-space driver creates one or more monitors, specifying for each monitor what counters it is interested in (up to 32 simultaneously, the hardware limit). The kernel returns a unique identifier for each monitor, which can be used later to do the measurement, query the results, and finally destroy it when done.
In this case, there isn’t an explicit start/stop the measurement. Rather, every time the driver wants to measure a job, it includes the identifier of the monitor it wants to use for that job, if any. Before submitting a job to the GPU, the kernel checks if the job has a monitor identifier attached. If so, then it needs to check if the previous job executed by the GPU was also using the same monitor identifier, in which case it doesn’t need to do anything other than send the job to the GPU, as the performance counters required are already enabled. If the monitor is different, then it needs first to read the current counter values (through proper GPU registers), adding them to the current monitor, stop the measurement, configure the counters for the new monitor, start the measurement again, and finally submit the new job to the GPU. In this process, if it turns out there wasn’t a monitor under execution before, then it only needs to execute the last steps.
The reason to do all this is that multiple applications can be executing at the same time, some using (different) performance counters, and most of them probably not using performance counters at all. But the performance counter values of one application shouldn’t affect any other application so we need to make sure we don’t mix up the counters between applications. Keeping the values in their respective monitors helps to accomplish this. There is still a small requirement in the user-space driver to help with accomplishing this, but in general, this is how we avoid the mixing.
If you want to take a look at the full implementation, it is available in a single commit.
Implementation in the driver
Once we have a way to create and manage the monitors, using them in the driver is quite easy: as mentioned before, we only need to create a monitor with the counters we are interested in and attach it to the job to be submitted to the kernel. In order to make things easier, we keep a mirror-like version of the monitor inside the driver.
This approach is adequate when you are developing the driver, and you can add code directly on it to check performance. But what about the final user, who is writing an OpenGL application and wants to check how to improve its performance, or check any bottleneck on it? We want the user to have a way to use OpenGL for this.
Fortunately, there is in fact a way to do this through OpenGL: the GL_AMD_performance_monitor extension. This OpenGL extension provides an API to query what counters the hardware supports, to create monitors, to start and stop them, and to retrieve the values. It looks very similar to what we have described so far, except for an important difference: the user needs to start and stop the monitors explicitly. We will explain later why this is necessary. But the key point here is that when we start a monitor, this means that from that moment on, until stopping it, any job created and submitted to the kernel will have the identifier of that monitor attached. This implies that only one monitor can be enabled in the application at the same time. But this isn’t a problem, as this restriction is part of the extension.
Our driver does not implement this API directly, but through “queries”, which are used then by the Gallium subsystem in Mesa to implement the extension. For reference, the V3D driver (as well as the VC4) is implemented as part of the Gallium subsystem. The Gallium part basically handles all the hardware-independent OpenGL functionality, and just requires the driver hook functions to be implemented by the driver. If the driver implements the proper functions, then Gallium exposes the right extension (in this case, the GL_AMD_performance_monitor extension).
For our case, it requires the driver to implement functions to return which counters are available, to create or destroy a query (in this case, the query is the same as the monitor), start and stop the query, and once it is finished, to get the results back.
At this point, I would like to explain a bit better what it implies to stop the monitor and get the results back. As explained earlier, stopping the monitor or query means that from that moment on, any new job submitted to the kernel (and thus to the GPU) won’t contain a performance monitor identifier attached, and hence won’t be measured. But it is important to know that the driver submits jobs to the kernel to be executed at its own pace, but these aren’t executed immediatly; the GPU needs time to execute the jobs, and so the kernel puts the arriving jobs in a queue, to be submitted to the GPU. This means when the user stops the monitor, there could be still jobs in the queue that haven’t been executed yet and are thus pending to be measured.
And how do we know that the jobs have been executed by the GPU? The hook function to implement getting the query results has a “wait” parameter, which tells if the function needs to wait for all the pending jobs to be measured to be executed or not. If it doesn’t but there are pending jobs, then it just returns telling the caller this fact. This allows to do other work meanwhile and query again later, instead of becoming blocked waiting for all the jobs to be executed. This is implemented through sync objects. Every time a job is sent to the kernel, there’s a sync object that is used to signal when the job has finished executing. This is mainly used to have a way to synchronize the jobs. In our case, when the user finalizes the query we save this fence for the last submitted job, and we use it to know when this last job has been executed.
There are quite a few details I’m not covering here. If you are interested though, you can take a look at the merge request.
Gallium HUD
So far we have seen how the performance counters are implemented, and how to use them. In all the cases it requires writing code to create the monitor/query, start/stop it, and querying back the results, either in the driver itself or in the application through the GL_AMD_performance_monitor extension1.
But what if we want to get some general measurements without adding code to the
application or the driver? Fortunately, there is an environmental
variable GALLIUM_HUD that, when correctly, will show on top of the
application some graphs with the measured counters.
Using it is very easy; set it to help to know how to use it, as well as to
get a list of the available counters for the current hardware.
As example:
$ env GALLIUM_HUD=L2T-CLE-reads,TLB-quads-passing-z-and-stencil-test,QPU-total-active-clk-cycles-vertex-coord-shading scorched3d
You will see:
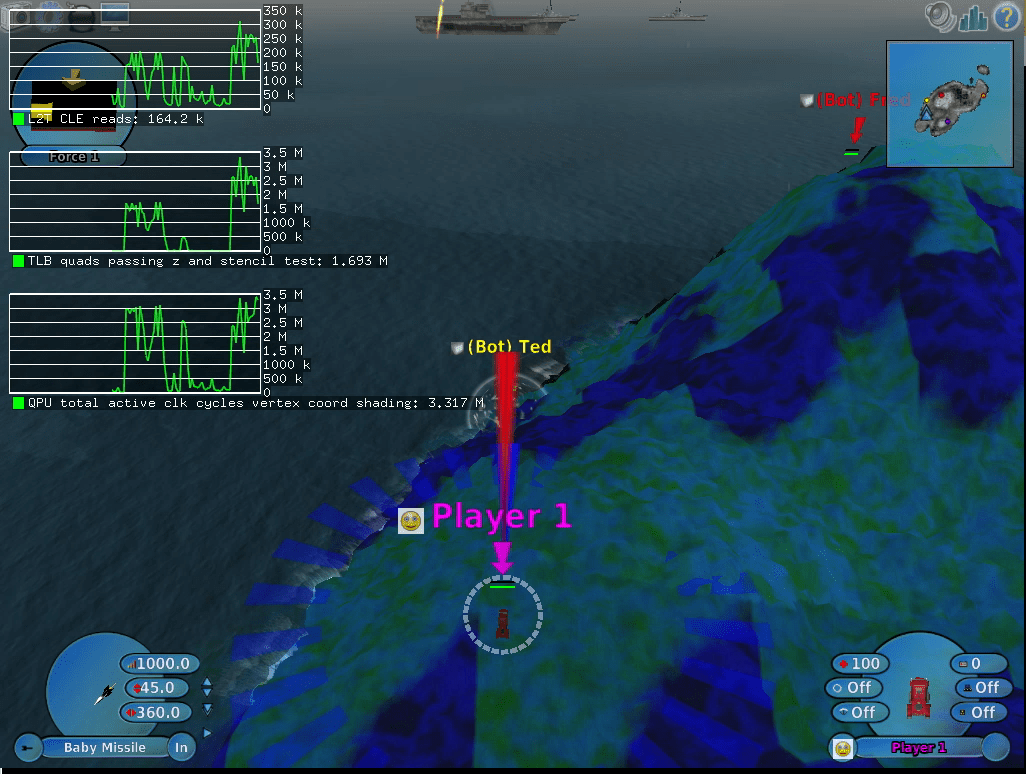
Bear in mind that to be able to use this you will need a kernel that supports performance counters for V3D. At the moment of writing this, no kernel has been released yet with this support. If you don’t want to wait for it, you can download the patch, apply it to your raspberry pi kernel (which has been tested in the 5.12 branch), build and install it.
-
All this is for the case of using OpenGL; if your application uses Vulkan, there are other similar extensions, which are not yet implemented in our V3DV driver at the moment of writing this post. ↩