How have you been developing Chromium? I have often been asked what is the best tool to develop Chromium. I guess Chromium developers have been usually using vim, emacs, cscope, sublime text, eclipse, etc. And they have used GDB or console logs for debugging. But, in case of Windows, developers have used Visual Studio. Although Visual Studio supports powerful features to develop C/C++ programs, unfortunately, it couldn’t be used by other platform developers. However, recently I notice that Visual Studio Code also can support to develop Chromium with the nice editor, powerful debugging tools, and a lot of extensions. And, even it can work on Linux and Mac because it is based on Electron. Nowadays I’m developing Chromium with VS Code. I feel that VS Code is one of the very nice tools to develop Chromium. So I’d like to share my experience how to develop Chromium by using the Visual Studio Code on Ubuntu.
Default settings for Chromium
* https://chromium.googlesource.com/chromium/src/+/lkcr/docs/vscode.md
- Download VS Code
https://code.visualstudio.com/docs/setup/setup-overview
- Launch VS Code in chromium/src
$ code .
- Install useful extensions
- c/c++ for visual studio code – Code formatting, debugging, Intellisense.
- Toggle Header/Source – Toggles between .cc and .h with
F4. The C/C++ extension supports this as well throughAlt+Obut sometimes chooses the wrong file when there are multiple files in the workspace that have the same name. - you-complete-me – YouCompleteMe code completion for VS Code. It works fairly well in Chromium. To install You-Complete-Me, enter these commands in a terminal:
$ git clone https://github.com/Valloric/ycmd.git ~/.ycmd
$ cd ~/.ycmd
$ git submodule update --init --recursive
$ ./build.py --clang-completer
- Rewrap – Wrap lines at 80 characters with
Alt+Q. - Highlighter Line – Highlights the current line in the editor. Find your location in your editor easily.
- c/c++ for visual studio code – Code formatting, debugging, Intellisense.
- Setup for Chromium
- Chromium added the default settings files for vscode. We can move them to //src/.vscode folder.
- Workspace setting
– https://cs.chromium.org/chromium/src/tools/vscode/settings.json5 - Task setting
– https://cs.chromium.org/chromium/src/tools/vscode/tasks.json5 - Launch setting
– https://cs.chromium.org/chromium/src/tools/vscode/launch.json5
- Workspace setting
- Chromium added the default settings files for vscode. We can move them to //src/.vscode folder.
- Key mapping
* Ctrl+P: opens a search box to find and open a file.
* F1 or Ctrl+Shift+P: opens a search box to find a command
  (e.g. Tasks: Run Task).
* Ctrl+K, Ctrl+S: opens the key bindings editor.
* Ctrl+`: toggles the built-in terminal.
* Ctrl+Shift+M: toggles the problems view (linter warnings,
  compile errors and warnings). You'll swicth a lot between
  terminal and problem view during compilation.
* Alt+O: switches between the source/header file.
* Ctrl+G: jumps to a line.
* F12: jumps to the definition of the symbol at the cursor
  (also available on right-click context menu).
* Shift+F12 or F1: CodeSearchReferences, Return shows all
  references of the symbol at the cursor.
* F1: CodeSearchOpen, Return opens the current file in
  Code Search.
* Ctrl+D: selects the word at the cursor. Pressing it multiple
  times multi-selects the next occurrences, so typing in one
  types in all of them, and Ctrl+U deselects the last occurrence.
* Ctrl+K+Z: enters Zen Mode, a fullscreen editing mode with
  nothing but the current editor visible.
* Ctrl+X: without anything selected cuts the current line.
  Ctrl+V pastes the line.
- (Optional) Color setting
- Press
Ctrl+Shift+P, color, Enterto pick a color scheme for the editor
- Press
Additional settings after the default settings.
- Set workspaceRoot to .bashrc. (Because it will be needed for some extensions.)
export workspaceRoot=$HOME/chromium/src
- Copy 3 settings files from //src/tools/vscode to //src/.vscode
-
$ mkdir .vscode/
$ cp tools/vscode/settings.json5 .vscode/settings.json
$ cp tools/vscode/tasks.json5 .vscode/tasks.json
$ cp tools/vscode/launch.json5 .vscode/launch.json
- You can find my configuration files based on the default files
-
- Set ycmd path to .vscode/settings.json
-
// YouCompleteMe
"ycmd.path": "<path>/.ycmd", // Please replace this path
-
- Add new tasks to tasks.json in order to build Chromium by using ICECC.
- I wrote a post about how to build Chromium by using ICECC in the previous post. Please setup it first.
- Add buildChromiumICECC.sh Debug to the tasks.json
{
  "taskName": "1-build_chrome_debug_icecc",
  "command": "buildChromiumICECC.sh Debug",
  "isShellCommand": true,
  "isTestCommand": true,
  "problemMatcher": [
    {
      "owner": "cpp",
      "fileLocation": [
        "relative",
        "${workspaceRoot}"
      ],
      "pattern": {
        "regexp": "^../../(.*):(\\d+):(\\d+):\\s+(warning|\\w*\\s?error):\\s+(.*)$",
        "file": 1,
        "line": 2,
        "column": 3,
        "severity": 4,
        "message": 5
      }
    },
    {
      "owner": "cpp",
      "fileLocation": [
        "relative",
        "${workspaceRoot}"
      ],
      "pattern": {
        "regexp": "^../../(.*?):(.*):\\s+(warning|\\w*\\s?error):\\s+(.*)$",
        "file": 1,
        "severity": 3,
        "message": 4
      }
    }
  ]
},
- Update “Chrome Debug” configuration in launch.json
{
  "name": "Chrome Debug",
  "type": "cppdbg",
  "request": "launch",
  "targetArchitecture": "x64",
  "environment": [
    {"name":"workspaceRoot", "value":"${HOME}/chromium/src"}
  ],
  "program": "${workspaceRoot}/out/Debug/chrome",
  "args": ["--single-process"],  // The debugger only can work with the single process mode for now.
  "preLaunchTask": "1-build_chrome_debug_icecc",
  "stopAtEntry": false,
  "cwd": "${workspaceRoot}/out/Debug",
  "externalConsole": true,
},
Screenshot after the settings
you will see this window after finishing all settings.
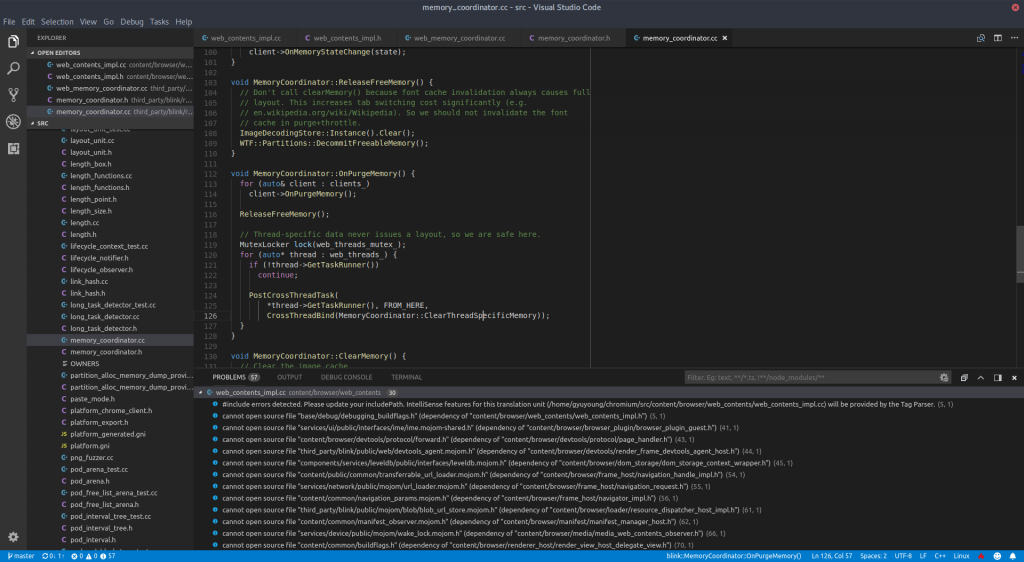
Build Chromium with ICECC in VS Code
- Run Task (Menu -> Terminal -> Run Tasks…)
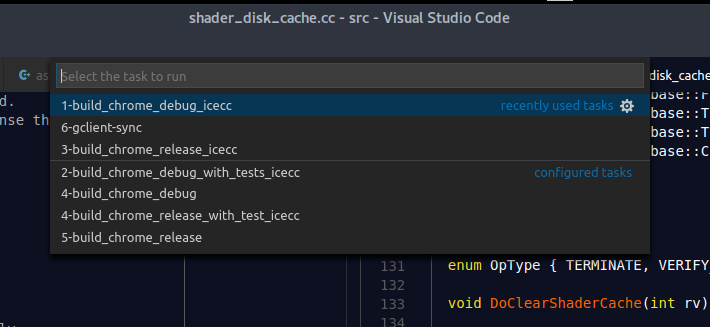
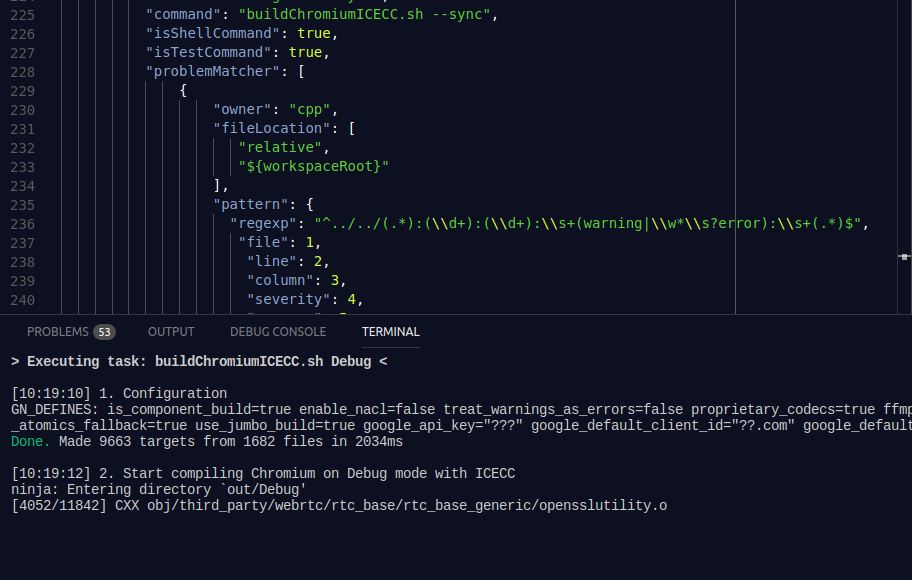
- Select 1-build_chrome_debug_icecc. VS Code will show an integrated terminal when building Chromium as below,
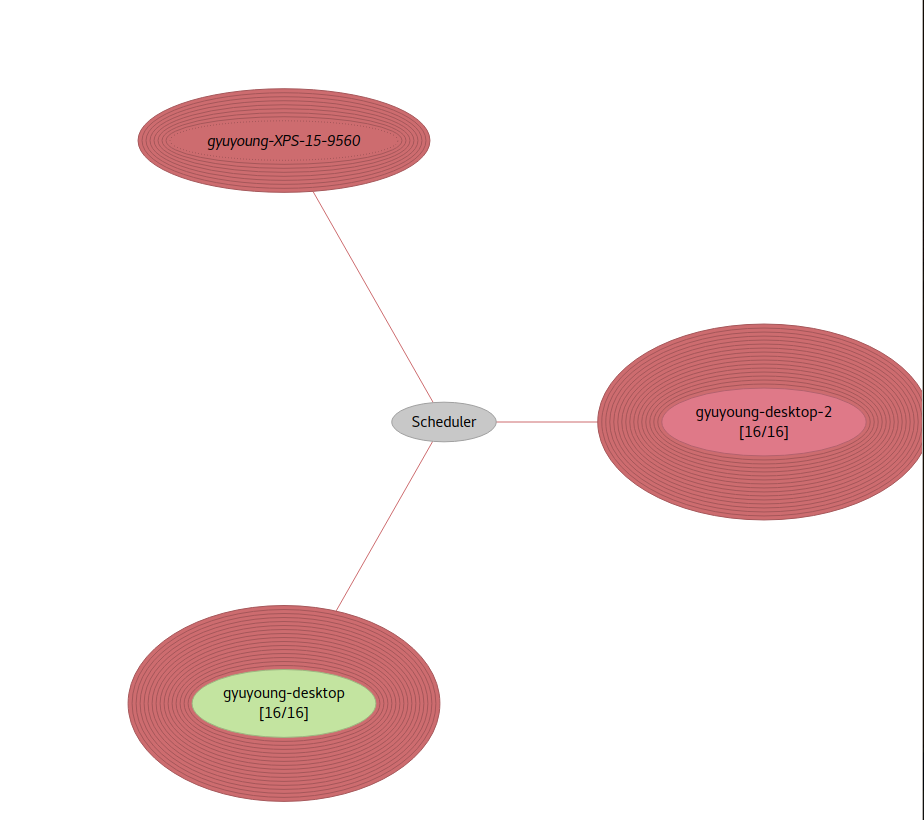
 On the ICECC monitor, you can see that VS Code builds Chromium by using ICECC.
Start debugging in VS Code
After completing the build, now is time to start debugging Chromium.
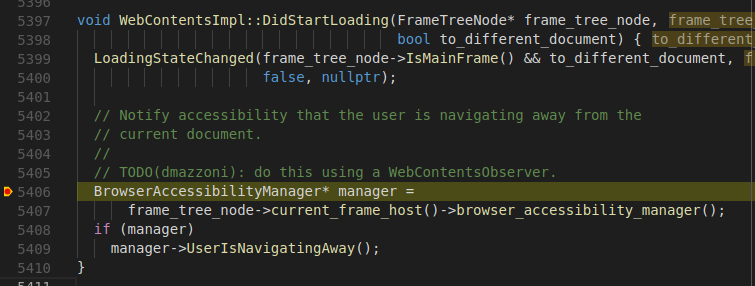
- Set a breakpoint
- F9 button or just click the left side of line number
- Launch debug
- Press F5 button
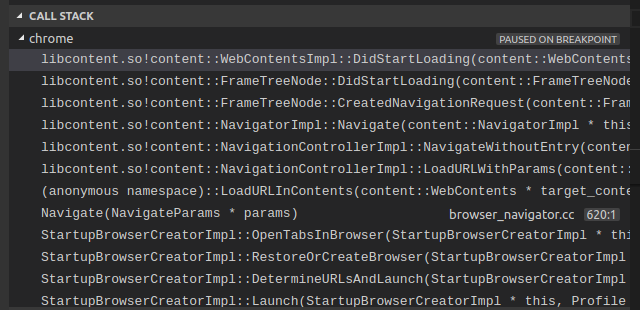
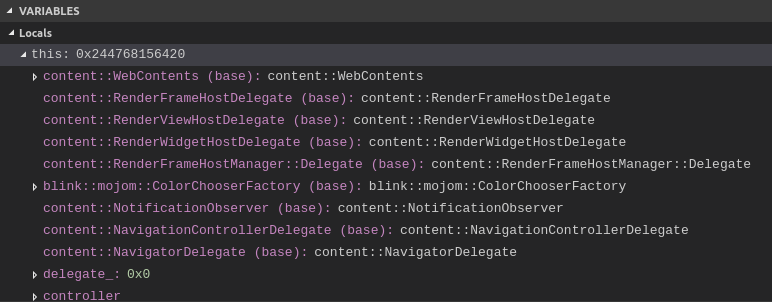
- Screen captures when debugger stopped at a breakpoint
- Overview
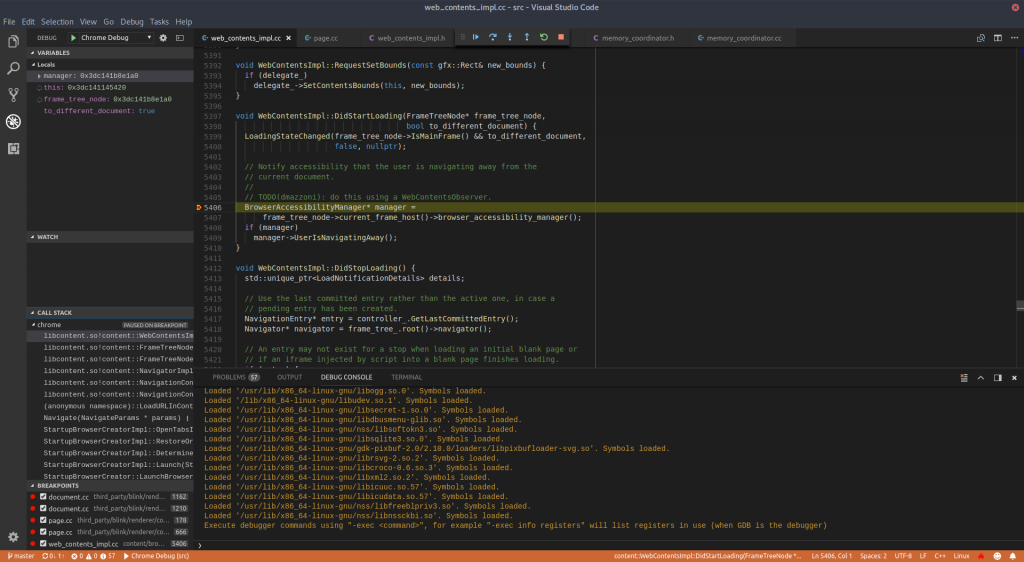
- Editor
- Call stack
- Variables
- Watch

- Breakpoints

- Overview
Todo
In multiple processes model, VS Code can’t debug child processes yet (i.e. renderer process). According to C/C++ extension project site, they suggested us to add the below command to launch.json though, it didn’t work for Chromium when I tried.
"setupCommands": [
    { "text": "-gdb-set follow-fork-mode child" }
],
