Setting up VisualStudio code to work with WebKitGTK using clangd

Lately I’m working on a refactor in the append pipeline of the MediaSource Extensions implementation of the WebKit for the GStreamer ports. Working on refactors often triggers many build issues, not only because they often encompass a lot of code, but also because it’s very easy to miss errors in the client code when updating an interface.

The traditional way to tackle this problem is by doing many build cycles: compile, fix the topmost error, and maybe some other errors on view that seem legit (note in C++ it’s very common to have chain errors that are consequence of previous errors), repeat until it builds successfully.

This approach is not very pleasant in a project like WebKit where an incremental build of a single file takes just enough time to cause the need for a distraction. It’s also worsened when it’s not just one file, but a complete build that may stop at any time, depending on the order the build system chooses for the files. Often it does take more time to wait for the compiler to show the error than to fix the error.

Unpleasant unfavors motivation, and lack of motivation unfavors productivity, and by the end of the day you are tired and still undone. Somehow it feels like the time spent fixing trivial build issues is substancially more than the time of a build cycle times the number of errors. Whether that perception is accurate or not, I am acutely aware of the huge impact having helpful tooling has on both productivity and quality of life, both while and after you’re done with the work, so I decided to have a look at the state of modern C++ language servers when working on a large codebase like WebKit. Previous experiences were very unsuccessful, but there are people dedicated to this and progress has been made.

Creating a WebKit project in VS Code

  1. Open the directory containing the WebKit checkout in VS Code.
  2. WebKit has A LOT of files. If you use Linux you will see a warning telling you increase the number of inotify watchers. Do so if you haven’t done it before, but even then, it will not be enough, because WebKit has more files than the maximum number of inotify watchers supported by the kernel. Also, they use memory.
  3. Go to File/Preferences/Settings, click the Workspace tab, search for Files: Watcher Exclude and add the following patterns:
    **/CMakeFiles/**
    **/JSTests/**
    **/LayoutTests/**
    **/Tools/buildstream/cache/**
    **/Tools/buildstream/repo/**
    **/WebKitBuild/UserFlatpak/repo/**

    This will keep the number of watches on a workable 258k. Still a lot, but under the 1M limit.

How to set up clangd

The following instructions assume you’re using WebKitGTK with the WebKit Flatpak SDK. They should also work for WPE with minimal substitutions.

  1. Microsoft has its own C++ plugin for VS Code, which may be installed by default. The authors of the clangd plugin recommend to uninstall the built-in C++ plugin, as running both doesn’t make much sense and could cause conflicts.
  2. Install the clangd extension for VS Code from the VS Code Marketplace.
  3. The WebKit flatpak SDK already includes clangd, so it’s not necessary to install it if you’re using it. On the other hand, because the flatpak has a virtual filesystem, it’s necessary to map paths from the flatpak to the outside. You can create this wrapper script for this purpose. Make sure to give it execution rights (chmod +x).
    #!/bin/bash
    set -eu
    # https://stackoverflow.com/a/17841619
    function join_by { local d=${1-} f=${2-}; if shift 2; then printf %s "$f" "${@/#/$d}"; fi; }
    
    local_webkit=/webkit
    include_path=("$local_webkit"/WebKitBuild/UserFlatpak/runtime/org.webkit.Sdk/x86_64/*/active/files/include)
    if [ ! -f "${include_path[0]}/stdio.h" ]; then
      echo "Couldn't find the directory hosting the /usr/include of the flatpak SDK."
      exit 1
    fi
    include_path="${include_path[0]}"
    mappings=(
      "$local_webkit/WebKitBuild/GTK/Debug=/app/webkit/WebKitBuild/Debug"
      "$local_webkit/WebKitBuild/GTK/Release=/app/webkit/WebKitBuild/Release"
      "$local_webkit=/app/webkit"
      "$include_path=/usr/include"
    )
    
    exec "$local_webkit"/Tools/Scripts/webkit-flatpak --gtk --debug run -c clangd --path-mappings="$(join_by , "${mappings[@]}")" "$@"

    Make sure to set the path of your WebKit repository in local_webkit.

    Then, in VS Code, go to File/Preferences/Settings, and in the left pane, search for Extensions/clangd. Change Clangd: Path to the absolute path of the saved script above. I recomend making these changes in the Workspace tab, so they apply only to WebKit.

  4. Create a symlink named compile_commands.json inside the root of the WebKit checkout directory pointing to the compile_commands.json file of the WebKit build you will be using, for instance: WebKitBuild/GTK/Debug/compile_commands.json
  5. Create a .clangd file inside the root of the WebKit checkout directory with these contents:
    If:
        PathMatch: "(/app/webkit/)?Source/.*\\.h"
        PathExclude: "(/app/webkit/)?Source/ThirdParty/.*"
    
    CompileFlags:
        Add: [-include, config.h]

    This includes config.h in header files in WebKit files, with the exception of those in Source/ThirdParty. Note: If you need to add additional rules, this is done by adding additional YAML documents, which are separated by a --- line.

  6. VS Code clangd plugin doesn’t read .clangd by default. Instead, it has to be instructed to do so by adding --enable-config to Clangd: Arguments. Also add --limit-results=5000, since the default limit for cross reference search results (100) is too small for WebKit.Additional tip: clangd will also add #include lines when you autocomplete a type. While the intention is good, this often can lead to spurious redundant includes. I have disabled it by adding --header-insertion=never to clangd’s arguments.
  7. Restart VS Code. Next time you open a C++ file you will get a prompt requesting confirmating your edited configuration:

VS Code will start indexing your code, and you will see a progress count in the status bar.

Debugging problems

clangd has a log. To see it, click View/Output, then in the Output panel combo box, select clangd.
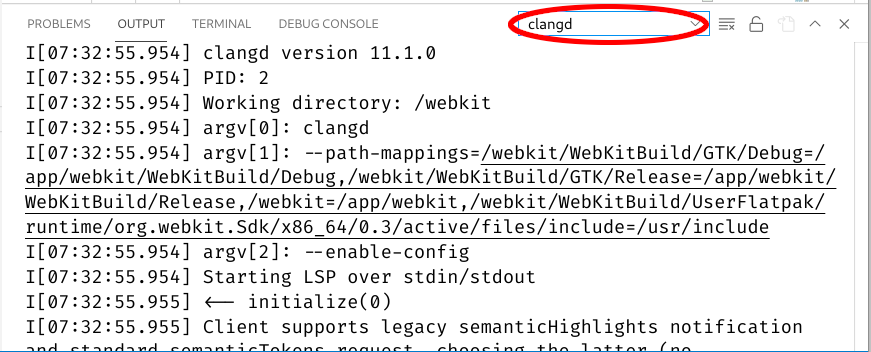
The clangd database is stored in .cache/clangd inside the WebKit checkout directory. rm -rf’ing that directory will reset it back to its initial state.

For each compilation unit indexed, you’ll find a file following the pattern .cache/clangd/index/<Name>.<Hash>.idx. For instance: .cache/clangd/index/MediaSampleGStreamer.cpp.0E0C77DCC76C3567.idx. This way you can check whether a particular compilation unit has been indexed.

Bug: Some files are not indexed

You may notice VS Code has not indexed all your files. This is apparent when using the Find all references feature, since you may be missing results. This in particular affects to generated code, in particular unified sources (.cpp files generated by concatenating via #include a series of related .cpp files with the purpose of speeding up the build, compared to compiling them as individual units).

I don’t know the reason for this bug, but I can confirm the following workaround: Open a UnifiedSources file. Any UnifiedSources file will do. You can find them in paths such as WebKitBuild/GTK/Debug/WebCore/DerivedSources/unified-sources/UnifiedSource-043dd90b-1.cpp. After you open any of them, you’ll see VS Code indexing over a thousand files that were skipped before. You can close the file now. Find all references should work once the indexing is done.

Things that work

Overall I’m quite satisfied with the setup. The following features work:

  • Autocompletion:
  • . gets replaced to -> when autocompleting a member inside an object accessible by dereferencing a pointer or smart pointer. (. will autocomplete not only the members of the object, but also of the pointee).
  • Right click/Find All References: What it founds is accurate, although I don’t feel very confident in it being exhaustive, as that requires a full index.
  • Right click/Show Call Hierarchy: This a useful tool that shows what functions call the selected function, and so on, automating what otherwise is a very manual process. At least, when it’s exhaustive enough.
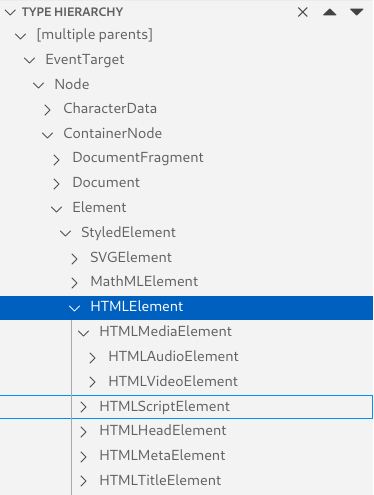
  • Right click/Type hierarchy: It shows the class tree containing a particular class (ancestors, children classes and siblings).
  • Error reporting: the right bar of VS Code will show errors and warnings that clangd identifies with the code. It’s important to note that there is a maximum number of errors per file, after which the checking will stop, so it’s a good idea to start from the top of the file. The errors seem quite precise and avoid a lot of trips to the compiler. Unfortunately, they’re not completely exhaustive, so even after the file shows no errors in clangd, it might still show errors in the actual compiler, but it still catches most with very detailed information.
  • Signature completion: after completing a function, you get help showing you what types the parameters expect

Known issues and workarounds

“Go to definition” not working sometimes

If “Go to definition” (ctrl+click on the name of a function) doesn’t work on a header file, try opening the source file by pressing Ctrl+o, then go back to the header file by pressing Ctrl+o again and try going to definition again.

Base functions of overriden functions don’t show up when looking for references

Although this is supposed to be a closed issue I can still reproduce it. For instance, when searching for uses of SourceBufferPrivateGStreamer::enqueueSample(), calls to the parent class, SourceBufferPrivate::enqueueSample() get ignored.

This is also a common issue when using Show Call Hierarchy.

Lots of strange errors after a rebase

Clean the cache, reindex the project. Close VS Code, rm -rf .cache/clangd/index inside the WebKit checkout directory, then open VS Code again. Remember to open a UnifiedSources file to create a complete index.

validateflow: A new tool to test GStreamer pipelines

It has been a while since GstValidate has been available. GstValidate has made it easier to write integration tests that check that playback and transcoding executing actions (like seeking, changing subtitle tracks, etc…) work as expected; testing at a high level rather than fine exact/fine grained data flow.

As GStreamer is applied to an ever wider variety of cases, testing often becomes cumbersome for those cases that resemble less typical playback. On one hand there is the C testing framework intended for unit tests, which is admittedly low level. Even when using something like GstHarness, checking an element outputs the correct buffers and events requires a lot of manual coding. On the other hand gst-validate so far has focused mostly on assets that can be played with a typical playbin, requiring extra effort and coding for the less straightforward cases.

This has historically left many specific test cases within that middle ground without an effective way to be tested. validateflow attempts to fill this gap by allowing gst-validate to test that custom pipelines acted in a certain way produce the expected result.

validateflow itself is a GstValidate plugin that records buffers and events flowing through a given pad and records them in a log file. The first time a test is run, this log becomes the expectation log. Further executions of the test still create a new log file, but this time it’s compared against the expectation log. Any difference is reported as an error. The user can rebaseline the tests by removing the expectation log file and running it again. This is very similar to how many web browser tests work (e.g. Web Platform Tests).

How to get it

validateflow has been landed recently on the development versions of GStreamer. Before 1.16 is released you’ll be able to use it by checking out the latest master branches of GStreamer subprojects, preferably with something like gst-build.

Make sure to update both gst-devtools. Then update gst-integration-testsuites by running the following command, that will update the repo and fetch media files. Otherwise you will get errors.

gst-validate-launcher --sync -L

Writing tests

The usual way to use validateflow is through pipelines.json, a file parsed by the validate test suite (the one run by default by gst-validate-launcher) where all the necessary elements of a validateflow tests can be placed together.

For instance:

"qtdemux_change_edit_list":
{
    "pipeline": "appsrc ! qtdemux ! fakesink async=false",
    "config": [
        "%(validateflow)s, pad=fakesink0:sink, record-buffers=false"
    ],
    "scenarios": [
        {
            "name": "default",
            "actions": [
                "description, seek=false, handles-states=false",
                "appsrc-push, target-element-name=appsrc0, file-name=\"%(medias)s/fragments/car-20120827-85.mp4/init.mp4\"",
                "appsrc-push, target-element-name=appsrc0, file-name=\"%(medias)s/fragments/car-20120827-85.mp4/media1.mp4\"",
                "checkpoint, text=\"A moov with a different edit list is now pushed\"",
                "appsrc-push, target-element-name=appsrc0, file-name=\"%(medias)s/fragments/car-20120827-86.mp4/init.mp4\"",
                "appsrc-push, target-element-name=appsrc0, file-name=\"%(medias)s/fragments/car-20120827-86.mp4/media2.mp4\"",
                "stop"
            ]
        }
    ]
},

These are:

  • pipeline: A string with the same syntax of gst-launch describing the pipeline to use. Python string interpolation can be used to get the path to the medias directory where audio and video assets are placed in the gst-integration-testsuites repo by writing %(media)s. It can also be used to get a video or audio sink that can be muted, with %(videosink)s or %(audiosink)s

  • config: A validate configuration file. Among other things that can be set, here validateflow overrides are defined, one per line, with %(validateflow)s, which expands to validateflow, plus some options defining where the logs will be written (which depends on the test name). Each override monitors one pad. The settings here define which pad, and what will be recorded.

  • scenarios: Usually a single scenario is provided. A series of actions performed in order on the pipeline. These are normal GstValidate scenarios, but new actions have been added, e.g. for controlling appsrc elements (so that you can push chunks of data in several steps instead of relying on a filesrc pushing a whole file and be done with it).

Running tests

The tests defined in pipelines.json are automatically run by default when running gst-validate-launcher, since they are part of the default test suite.

You can get the list of all the pipelines.json tests like this:

gst-validate-launcher -L |grep launch_pipeline

You can use these test names to run specific tests. The -v flag is useful to see the actions as they are executed. --gdb runs the test inside the GNU debugger.

gst-validate-launcher -v validate.launch_pipeline.qtdemux_change_edit_list.default

In the command line argument above validate. defines the name of the test suite Python file, testsuites/validate.py. The rest, launch_pipeline.qtdemux_change_edit_list.default is actually a regex: actually . just happens to match a period but it would match any character (it would be more correct, albeit also more inconvenient, to use \. instead). You can use this feature to run several related tests, for instance:

$ gst-validate-launcher -m 'validate.launch_pipeline\.appsrc_.*'

Setting up GstValidate default tests

[3 / 3]  validate.launch_pipeline.appsrc_preroll_test.single_push: Passed

Statistics:
-----------                                                  

           Total time spent: 0:00:00.369149 seconds

           Passed: 3
           Failed: 0
           ---------
           Total: 3

Expectation files are stored in a directory named flow-expectations, e.g.:

~/gst-validate/gst-integration-testsuites/flow-expectations/qtdemux_change_edit_list/log-fakesink0:sink-expected

The actual output log (which is compared to the expectations) is stored as a log file, e.g.:

~/gst-validate/logs/qtdemux_change_edit_list/log-fakesink0:sink-actual

Here is how a validateflow log looks.

event stream-start: GstEventStreamStart, flags=(GstStreamFlags)GST_STREAM_FLAG_NONE, group-id=(uint)1;
event caps: video/x-h264, stream-format=(string)avc, alignment=(string)au, level=(string)2.1, profile=(string)main, codec_data=(buffer)014d4015ffe10016674d4015d901b1fe4e1000003e90000bb800f162e48001000468eb8f20, width=(int)426, height=(int)240, pixel-aspect-ratio=(fraction)1/1;
event segment: format=TIME, start=0:00:00.000000000, offset=0:00:00.000000000, stop=none, time=0:00:00.000000000, base=0:00:00.000000000, position=0:00:00.000000000
event tag: GstTagList-stream, taglist=(taglist)"taglist\,\ video-codec\=\(string\)\"H.264\\\ /\\\ AVC\"\;";
event tag: GstTagList-global, taglist=(taglist)"taglist\,\ datetime\=\(datetime\)2012-08-27T01:00:50Z\,\ container-format\=\(string\)\"ISO\\\ fMP4\"\;";
event tag: GstTagList-stream, taglist=(taglist)"taglist\,\ video-codec\=\(string\)\"H.264\\\ /\\\ AVC\"\;";
event caps: video/x-h264, stream-format=(string)avc, alignment=(string)au, level=(string)2.1, profile=(string)main, codec_data=(buffer)014d4015ffe10016674d4015d901b1fe4e1000003e90000bb800f162e48001000468eb8f20, width=(int)426, height=(int)240, pixel-aspect-ratio=(fraction)1/1, framerate=(fraction)24000/1001;

CHECKPOINT: A moov with a different edit list is now pushed

event caps: video/x-h264, stream-format=(string)avc, alignment=(string)au, level=(string)3, profile=(string)main, codec_data=(buffer)014d401effe10016674d401ee8805017fcb0800001f480005dc0078b168901000468ebaf20, width=(int)640, height=(int)360, pixel-aspect-ratio=(fraction)1/1;
event segment: format=TIME, start=0:00:00.041711111, offset=0:00:00.000000000, stop=none, time=0:00:00.000000000, base=0:00:00.000000000, position=0:00:00.041711111
event tag: GstTagList-stream, taglist=(taglist)"taglist\,\ video-codec\=\(string\)\"H.264\\\ /\\\ AVC\"\;";
event caps: video/x-h264, stream-format=(string)avc, alignment=(string)au, level=(string)3, profile=(string)main, codec_data=(buffer)014d401effe10016674d401ee8805017fcb0800001f480005dc0078b168901000468ebaf20, width=(int)640, height=(int)360, pixel-aspect-ratio=(fraction)1/1, framerate=(fraction)24000/1001;

Prerolling and appsrc

By default scenarios don’t start executing actions until the pipeline is playing. Also by default sinks require a preroll for that to occur (that is, a buffer must reach the sink before the state transition to playing is completed).

This poses a problem for scenarios using appsrc, as no action will be executed until a buffer reaches the sink, but a buffer can only be pushed as the result of an appsrc-push action, creating a chicken and egg problem.

For many cases that don’t require playback we can solve this simply by disabling prerolling altogether, setting async=false in the sinks.

For cases where prerolling is desired (like playback), handles_states=true should be set in the scenario description. This makes the scenario actions run without having to wait for a state change. appsrc-push will notice the pipeline is in a state where buffers can’t flow and enqueue the buffer without waiting for it so that the next action can run immediately. Then the set-state can be used to set the state of the pipeline to playing, which will let the appsrc emit the buffer.

description, seek=false, handles-states=true
appsrc-push, target-element-name=appsrc0, file-name="raw_h264.0.mp4"
set-state, state=playing
appsrc-eos, target-element-name=appsrc0

Documentation

The documentation of validateflow, explaining its usage in more detail can be found here:

https://gstreamer.freedesktop.org/documentation/gst-devtools-1.0/plugins/validateflow.html