WPE memory leak investigation playbook
Depending on the web application, the WPE WebKit memory usage trend can vary. When simple web applications are being processed, the memory consumption tends to be virtually stable (the same) no matter the period. However, when more complicated web applications are being executed, the memory usage usually grows over time while going back to normal from time to time e.g., when GC / memory pressure mechanism releases all kinds of caches and not-needed memory. Therefore, memory growth itself is not unusual. Nevertheless, as the memory leaks happen in WPE at times, the memory growth is worth investigating — especially if very rapid or unbounded.
This article presents a structured playbook for investigating such a memory growth and memory leaks in WPE. Rather than diving straight into debugging tools, it starts from first principles: confirming the problem is real, choosing the right environment to work in, and narrowing down the leaking area before any heavy tooling is involved. The goal is to reach actual debugging as fast as possible, regardless of whether the environment is an embedded device or a desktop machine, and regardless of how quickly the problem reproduces.
Playbook #
The high-level list of recommended steps to follow is presented below. In a nutshell, the steps 1, 2, and 3 are meant to choose and follow the fastest possible investigation path so that actual debugging of the problem (step 4) can be started as soon as possible.
- Confirming the problem
- Identifying the best setup for reproducing the problem
- Narrowing down
- Debugging
1. Confirming the problem #
The ultimate first step when working with alleged memory leak is to check whether the observed memory growth is actually abnormal. In the case of web browsers in general, the memory growth alone may not necessarily mean something is leaking. There may be many regular reasons why the browser’s memory usage is growing, but the usual suspects are:
- JavaScript-level memory allocations — due to the very nature of JavaScript, the memory it allocates causes the overall web content process memory growth up until the garbage collector (GC) kicks in. Then (from the RSS perspective) some memory is usually freed. However, as it’s not easy to predict when the GC will be invoked (e.g., when the browser processes an application that performs heavy rendering), it’s possible that memory will grow but remain garbage-collectible.
- JavaScript Just-in-Time (JIT) compilation — when not explicitly disabled or limited, the processing of any web application that has JavaScript code associated with it will cause the browser to continuously compile the JavaScript code in the background so that it executes such code faster in runtime at the expense of memory that is required for storing compiled artifacts.
- Caches — as the WPE operates, it caches things such as web resources, style resolution artifacts, textures, glyph atlases, layer tiles, display lists, rasterization artifacts, and many others. Naturally, the cache sizes are limited, however, if many caches are growing at the same time, they may create an impression of a leak. The difference in that case is, the caches stop growing at some point.
Due to the above, to confirm the memory growth is abnormal, one should usually try the following first:
- Triggering memory pressure to force the browser to trigger GC and evict as many cache entries as possible,
- Rerunning the browser with JIT disabled to rule out the JIT-related memory growth — unless the application code is very small.
If the memory growth doesn’t stop with JIT disabled or its level does not go back to normal after triggering memory pressure, the growth can be assumed to be abnormal, and one can proceed to the next step.
2. Identifying the best setup for reproducing the problem #
When the memory growth is atypical, it needs to be narrowed down in a way that the final debugging is possible. For both narrowing down and the debugging, one should aim at the most flexible development environment along with the smallest possible web application that reproduces the problem quickly. What it means in practice is — desktop environment along with small demo web application that reproduces the problem. Whilst it’s not always possible to have such an environment, the 3 general rules are as follows:
- Desktop environment is usually better than embedded one in terms of working with memory leaks as it offers minimal overhead (e.g., in terms of compilation times) and huge flexibility in choosing the industry standard tools for profiling/debugging.
- Small web application is always better than a big one as long as it still reproduces the same problem in the same amount of time. In such case, a small application minimizes the amount of noise that usually stands in the way of profiling/debugging.
- A web application that reproduces the problem quickly is always better than the one that needs much more time for it. The worst thing that can happen in the case of narrowing down memory leaks, is when the memory growth is noticeable or starts after a very long time such as hours/days+.
Given the above, at this point one should go through the below steps:
- Check if the setup is trivial enough already — if the web application reproduces the problem quickly in a desktop environment and is simple enough, one should immediately jump to the Debugging section.
- Check if the problem can be reproduced on desktop assuming it originally reproduces on embedded.
- Check if the problem can be reproduced faster if it’s not reproducing fast enough.
- Check if the web application could be simplified.
Once the setup is simplified as much as possible, one should proceed to one of narrowing down sections depending on the setup. Also, if the setup is still not ideal, one should actively seek opportunities for simplifying the setup even during narrowing down as it’s likely that some new information will eventually open new possibilities in terms of simplifying setup.
3. Narrowing down #
When the problem has been confirmed but there are not enough clues to tell exactly which parts leak, the debugging cannot be started right away. In such case, it’s necessary to narrow down the problem to the browser/application area that can be easily debugged.
While in some cases narrowing down is not even necessary, quite often it takes orders of magnitude more time than actual debugging, and hence one should pay special attention to this step.
3a. Narrowing down on embedded when the problem takes a long time to reproduce #
This is the toughest situation one can find themselves in. When a problem takes a long time to reproduce (hours/days+), every iteration/test comes automatically with a significant cost. Moreover, when the environment is an embedded one, rebuilding WPE is usually more time-consuming and the amount of tooling is usually limited — or requires some work to bring it to the image at least.
Due to the above, narrowing down the problem in this setup requires a structured approach with extra care. In such case, the things to check should be approached in steps defined as follows:
- Things to check without rerunning the WebKit
- in case of embedded devices, extra care is needed when attaching a memory profiler. On low-end devices, memory profilers tend to slow down the application hard enough to trigger otherwise non-existent problems.
- Things to check without rebuilding the WebKit
- in case of embedded devices, one should prefer limiting JIT over disabling it as without it, the JS execution may be slow enough to trigger unexpected scenarios.
- Things to check if rebuilding WebKit
Ideally, while checking various things along the above steps, one should batch as many checks as possible within individual tests.
3b. Narrowing down on embedded when the problem reproduces quickly #
When the problem reproduces quickly, the limitations of embedded environment are not that relevant. In this scenario, one should prioritize getting debug symbols (RelWithDebInfo build) into the image and utilizing them by running
the browser with whatever profilers are available. For the specific things to check, one should seek inspiration in the following groups:
3c. Narrowing down on desktop when the problem takes a long time to reproduce #
This situation is similar to 3a and hence one should follow the things to check from the following groups:
- Things to check without rerunning the WebKit.
- Things to check without rebuilding the WebKit.
- Things to check if rebuilding WebKit.
However, this time, there are some extra opportunities around tooling:
- There should be many more tools available already in the system or available to be installed.
- Tools such as memory profilers that could slow down the application making it unusable on embedded, may turn out to be working well when the desktop-class processing power is available.
With the above in mind, it’s worth trying all the tools available with priority because if at least one tool works well, one can save hours of narrowing down.
3d. Narrowing down on desktop when the problem reproduces quickly #
This is technically the simplest possible scenario, so basically, all the possibilities are available. The most time-consuming activity in this case is very likely rebuilding WebKit itself — although it should still be relatively fast.
In such case, just after a few quick checks with the Web Inspector, it’s recommended to get debug symbols (RelWithDebInfo build) and start with tools such as memory profilers.
Other than the above, one should go through the following groups on things to check:
4. Debugging #
The WPE debugging is twofold and depends on whether the problem is within the engine (usually C/C++ code) or the web application (JavaScript code).
When problem lies in the engine #
Debugging WPE WebKit is the same as debugging any other C/C++ application on Linux (or Mac if the issue is cross-port and one prefers an Apple port to work with), and hence is outside the scope of this article. Some WebKit-specific information can be found in the WebKit Documentation article on building and debugging page and therefore is recommended as a first step.
When problem lies in web application #
When the problem lies in JavaScript code, the situation is usually fairly straightforward. The majority of bugs in this area should be reproducible across various browser engines and hence a full variety of tooling should be available. If the WebKit is preferred or if the problem reproduces only there, the tooling available is still very useful and helps debugging problems quickly. The ultimate tool in such case is the Web Inspector. On official WebKit’s web page there’s entire index of articles on Web Inspector. Among those, the most interesting read is about Timelines Tab where the most useful debugging can be done. Once the features of Timelines Tab are understood, the next important article is the memory debugging guide. It dives into the most important Timelines Tab subsections and showcases the work with heap snapshots which is a key. To supplement it, it’s very important to know the heap snapshot delta feature which is basically about button:
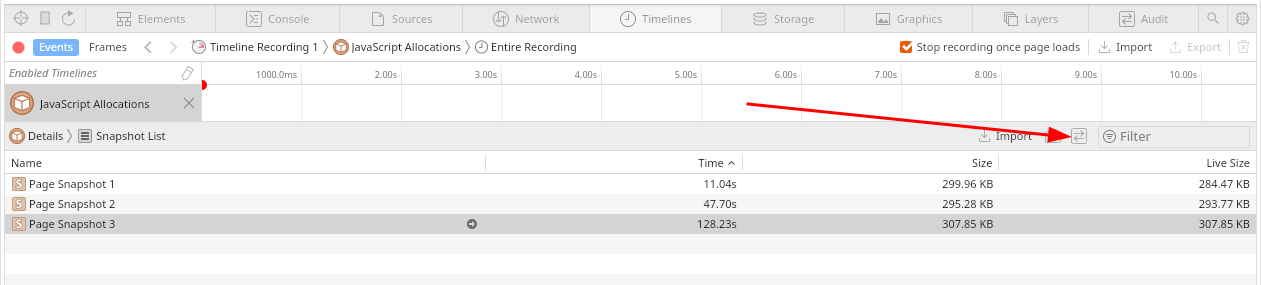
that allows one to inspect the delta-snapshot between 2 snapshots. It’s critical as it answers the question on what JS objects were added between the base snapshot and the later one. If some objects are piling up, it immediately shows which ones.
One important note on snapshots is that in some cases when using Web Inspector is not possible, one can generate the snapshots manually from the web engine’s C++ code by just calling GarbageCollectionController::singleton().dumpHeap(); at
some appropriate moment. In this case, the dump will be written to standard output. It can be then turned into a file and imported from any Web Inspector using Import button.
As the Timelines Tab with its subsections should be able to answer on what happens, to understand why it actually happens, the last missing piece is the JS debugger within Web Inspector. It’s not very different to debuggers in other engines, but it’s worth checking a dedicated article on it just to understand the capabilities.
Appendix #
Things to check without rerunning the webkit #
Even if the WPE is running with default settings in release mode, there are plenty of useful things that can be checked while the browser is still running:
- Identifying which WebKit process allocates abnormally,
- there are multiple ways to do this, but usually it’s as easy as using
psutility.
- there are multiple ways to do this, but usually it’s as easy as using
- Identifying how fast the process in question allocates the memory,
- this is useful to know at least for comparison purposes, but it may hint some problems already if the numbers correlate with what web application does.
- Checking logs from stdout, stderr, and journal (using
journalctl). - Checking detailed process memory statistics.
- Triggering and checking the impact of memory pressure on given processes RSS,
- in short, memory pressure triggers the cleanup of the majority of caches along with GC. Therefore, if this is able to bring memory back to normal level, then the problem is about caches, JS Heap / GC, or fragmentation.
- Attaching memory profilers if available,
- even if the debug symbols are not present, this may be useful to see what data is being captured and how the web application behaves when slowed down by profiler.
- Attaching other tools if available,
- even if the debug symbols are not present, various tools offer different perspectives on what the browser is doing. In some cases, such information may reveal some anomalies that may be related to the main issue.
- Cross-checking with other browsers,
- if other browsers show a similar pattern of memory usage, it’s very likely the problem lies in web application itself. Otherwise, it strongly suggests a bug in the WPE.
- Cross-checking with other ports,
- if any other WebKit port shows a similar pattern of memory usage, it allows one to narrow down the area in the code a bit based on what port it is:
- if the same behavior is visible in any of Apple ports, the problem is most likely related to cross-platform code,
- if the same behavior is visible only in GTK port, then the problem is most likely related to GLib-related part, coordinated graphics part, GStreamer-related part, or others that are shared.
- if any other WebKit port shows a similar pattern of memory usage, it allows one to narrow down the area in the code a bit based on what port it is:
Things to check without rebuilding the webkit #
- Tweaking and checking the logs from WPE,
- while generic logs may hint some unusual behavior, more specific ones such as GC logs (
JSC_logGC=1) may be used to check how the individual JS heap sizes evolve over time and how GC behaves. If it’s JavaScript leaking the memory, this log will quickly provide the evidence.
- while generic logs may hint some unusual behavior, more specific ones such as GC logs (
- Enabling Remote Web Inspector and checking:
- both breakdown and trend of memory usage in the memory timeline after doing a bit of recording,
- the effects of
takeHeapSnapshot()invoked from JS console:- as this function usually triggers GC internally, it may be used to check how much RSS memory is reclaimed by GC in isolation (followed up by scavenger),
- as this function takes a JS heap snapshot, it then can be used to explore manually if its contents point towards something interesting.
- Disabling JIT and checking the memory usage,
- if the memory usage is stable with JIT disabled, one should proceed to the step below.
- Limiting JIT and checking the memory usage,
- there are at least a few places (levels) where JIT compilation engine allocates memory. If limiting doesn’t resolve the issue completely, it’s likely the engine itself leaks some memory around temporary helper-heaps such as
AssemblerDataetc.
- there are at least a few places (levels) where JIT compilation engine allocates memory. If limiting doesn’t resolve the issue completely, it’s likely the engine itself leaks some memory around temporary helper-heaps such as
- Experimenting with environment variables and runtime preferences,
- some environment variables and runtime preferences change the behavior of the web engine significantly. If changing one of them makes the problem go away, it usually helps to narrow down the problematic area quickly.
- Running WPE with system malloc (environment variable
Malloc=1) and checking the memory usage,- when one suspects bmalloc/libpas issues with fragmentation or scavenger, it’s worth running a browser with system malloc to compare the memory evolution over time against the bmalloc/libpas.
- Limiting device memory and checking the memory usage,
- if triggering memory pressure is not possible, an alternative solution is to limit the device memory so that the browser is under constant memory pressure.
- Running WPE with sysprof and checking:
- stack traces — to see what parts of engine are particularly active as it may hint some problematic area,
- WebKit marks — to see what the engine is doing as well as quantitative data in marks such as
EventLoopRunetc. as in those cases the numeric value trends may reveal resource pile up.
Things to check if rebuilding webkit #
- Building WPE in release mode with debug symbols and re-trying memory profilers or other tools if the debug symbols were not present before,
- if some desired tools such as heaptrack, valgrind, perf, or strace were not available before, it’s the right moment to get/build them as well,
- once the debug symbols are in, one should try:
- attaching memory profilers if available, and inspecting detailed memory allocation reports,
- attaching other tools if available, and investigating the traces.
- Building and running with Google perftools,
- as WPE allows switching to system malloc as an allocator, it’s possible to use custom malloc implementation with instrumentation such as gperftools. For that, the recommended read is this article from fellow Igalian, Pablo Saavedra.
- Building and running with sanitizers,
- if the problem is about low-level leak, address/leak sanitizer should be able to help pointing out the problematic area.
- Building and running with memory sampler,
- the data produced by memory sampler is roughly the same as inspector’s memory timeline, however, it’s much more convenient as it doesn’t need web inspector at all.
- Building and running with node statistics,
- when memory growth seems to be related to DOM mutations, it’s worth enabling and reporting node statistics periodically — in some cases, it may directly suggest what the problem is about.
- Building and running with malloc heap breakdown,
- when all other means fail, a very good last-resort approach for investigating memory usage statistics via a debug-only WebKit feature called Malloc Heap Breakdown. The details can be found in the dedicated article about it.
- Building and running with libpas statistics,
- On very rare occasions such as memory fragmentation or allocation issues, it may be worth checking the libpas (low-level memory allocation and management library) statistics as WPE uses it by default on the vast majority of platforms.
Individual instructions #
Checking detailed process memory statistics #
As WPE WebKit uses multi-process architecture, there are multiple processes that can be checked, although the most interesting one is usually the Web Content Process. Once the PID of the given process is determined (e.g., using ps utility)
the usual steps to check detailed memory statistics are:
cat /proc/<PID>/statusorcat /proc/<PID>/statmfor very basic statistics,pmap -X <PID>- for detailed statistics (if available),cat /proc/<PID>/smaps_rollupandcat /proc/<PID>/smapsfor detailed statistics (requiresCONFIG_PROC_PAGE_MONITORkernel configuration option).
Triggering memory pressure from OS #
WPE uses a so-called Memory Pressure Monitor to observe the memory usage in the system and to react if there’s not much memory left. The default thresholds are specified in MemoryPressureMonitor.cpp and usually are
90% for non-critical and 95% for critical response. Depending on the response, WPE schedules GC and clears internal caches immediately.
As the above is usually on by default, one can leverage it to trigger GC (along with cache cleanups) by filling up the available memory in the OS to 95+%. There are many ways to allocate memory, yet the simplest is using stress:
- e.g.
stress --vm 1 --vm-bytes 1024M --vm-keepto allocate 1024 MB.
Attaching memory profilers #
When attaching any memory profiler, unless one wants to profile only native allocations (Skia, GStreamer, ICU, etc.), the key is to use Malloc=1 environment variable on WPE startup so that bmalloc uses system malloc instead of libpas.
Also, if WebKit is using a sanboxed mode in given configuration, it’s usually necessary to use WEBKIT_DISABLE_SANDBOX_THIS_IS_DANGEROUS=1 as well. Then the commands are as follows:
- to attach heaptrack:
heaptrack -p <PID>so e.g.heaptrack -p $(pgrep WPEWebProcess)(see this article for details),
- to run with valgrind’s massif (as attaching to running process is not possible):
valgrind --tool=massif --trace-children=yes <WPE-BROWSER-COMMAND>(see this article for details).
Attaching other tools #
If memory profilers are unusable or unavailable, it’s worth checking if other tools are present and experimenting a bit with them if so. In some cases, tools other than memory profilers may give some hints on further investigation or reveal a suspicious pattern within application execution. Some ideas for experiments with various tools are listed below:
- strace:
strace -c -p $(pgrep WPEWebProcess)— strace called with-cgives a nice summary of system calls executed by the traced application. It can be useful to check the overall syscall usage pattern to see if there are any anomalies.strace -p $(pgrep WPEWebProcess) -e trace=mmap,munmap,mremap,madvise -tt— strace focused onmmap()-related system calls may be useful to debug libpas.
- perf:
perf record -F 999 -ag -p $(pgrep WPEWebProcess) -- sleep 60— regular recording with perf can be very useful, especially if symbols are available. With that, one can generate flamegraphs and investigate what’s going on in the browser. While it’s not about profiling memory, it may be helpful to narrow down at least a bit.perf record -F 999 -e syscalls:sys_enter_mmap,syscalls:sys_enter_munmap,syscalls:sys_enter_mremap:sys_enter_madvise -ag -p $(pgrep WPEWebProcess) -- sleep 60— perf focused onmmap()-related system calls is much more superior than e.g. strace as it also records stack traces. Therefore, if debug symbols are present, and if the memory growth is very rapid, it’s very likely the libpasmmap()stacktraces will lead to the growth origin statistically.perf trace -e mmap,munmap,mremap,madvise -p $(pgrep WPEWebProcess)— this is very much similar to strace focused onmmap()-related system calls as it shows a live preview of what’s happening.
- sysprof:
sysprof-cli -f— while running system-wide sysprof won’t make WPE push marks into it, the profiling trace may still be useful to some degree, especially if debug symbols are available.
Disabling JIT #
This can be done using an environment variable:
JSC_useJIT=false.
Limiting JIT #
Limiting JIT can be achieved via environment variables:
JSC_jitMemoryReservationSize=<BYTES>to limit JIT memory usage (the limit is semi-strict as some JIT compilation engine buffers are limited by this value indirectly),JSC_useFTLJIT=falseto disable FTL tier,JSC_useDFGJIT=falseto disable DFG and FTL tiers,JSC_useBaselineJIT=falseto disable Baseline, DFG, and FTL tiers.
Tweaking WPE logs #
WPE is a fairly complex piece of software and hence it offers various logging capabilities related to WebKit itself, as well as to related libraries. The vast majority of logging can be controlled via environment variables:
WEBKIT_DEBUG=allto enable all logging channels,WEBKIT_DEBUG=Layout,Media=debug,Events=debugto enable selected logging channels,JSC_logGC=2to enable JS garbage collector logs,GST_DEBUG=4to enable gstreamer (multimedia-related) logs (see the documentation),G_MESSAGES_DEBUG=allto enable GLib-level logs.
If MiniBrowser (or similar browser) is used, one can also set a runtime preference to enable JS console.log(...) logging to the standard output:
--features=+LogsPageMessagesToSystemConsole.
Enabling remote web inspector #
Enabling WPE’s remote web inspector is a twofold process:
- The first step is to run WPE with the proper environment variable so that it starts listening on
IP:PORTusing tcp socket:
WEBKIT_INSPECTOR_SERVER=IP:PORTis the most reasonable option as it usesinspector://protocol that can be utilized by WebKit-native browsers such as GNOME Web (Epiphany) or Safari,WEBKIT_INSPECTOR_HTTP_SERVER=IP:PORTis a less preferable alternative that uses HTTP protocol and technically works from any browser. However, no seamless integration is guaranteed in this case.
- The second step is to connect from a regular web browser to the WPE:
- using
inspector://IP:PORT/if native inspector server was started, - using
http://IP:PORT/if HTTP inspector server was started, - forwarding the ports using
socat tcp-l:PORT,fork,reuseaddr tcp:IP:PORTif the WPE is running in unreachable network.
Experimenting with environment variables and runtime preferences #
The most outstanding environment variables changing the behavior of WPE are the following:
WPE_DISPLAY— assuming the new WPE platform API is used, this environment variable allows one to switch the pre-defined platform implementation thus changing a platform-facing part of graphics pipeline. The valid options are:WPE_DISPLAY=wpe-display-headless— for headless implementation,WPE_DISPLAY=wpe-display-drm— for direct rendering manager integration,WPE_DISPLAY=wpe-display-wayland— for wayland integration,
WEBKIT_SKIA_ENABLE_CPU_RENDERING— when set to1, rendering the DOM contents to the layers is done using Skia CPU backend instead of GPU one.
The most outstanding runtime preferences changing the behavior of WPE are the following:
CanvasUsesAcceleratedDrawing— when disabled, 2D canvas will use Skia CPU backend instead of GPU one,LayerBasedSVGEngine— when enabled, WPE uses a different SVG engine internally,AcceleratedCompositing— when disabled, WPE uses experimental, non-composited mode that bypasses all of the compositor work.
Limiting device memory #
On the majority of embedded devices, the device memory can be limited by:
- Interrupting the boot sequence (usually holding some key such as
zupon booting), - Invoking the command to change the limit and booting, e.g.:
> global linux.bootargs.console="console=ttymxc0,115200n8 mem=2G"
> boot
Running WPE with sysprof #
Regardless of whether it’s done on desktop (using wkdev-sdk) or on embedded device, the command is always as simple as:
sysprof-cli -f -- <WPE-INVOCATION>.
See the documentation entry for more details.
Building WPE in release mode with debug symbols #
On desktop, the simplest way to get release with debug symbols is to utilize CMake’s build type by using -DCMAKE_BUILD_TYPE=RelWithDebInfo within WPE build command, so:
./Tools/Scripts/build-webkit --wpe --release --cmakeargs="-DCMAKE_BUILD_TYPE=RelWithDebInfo".
On embedded, when Yocto is used, one should tweak settings such as:
IMAGE_GEN_DEBUGFS = "1"
IMAGE_FSTYPES_DEBUGFS = "tar.bz2"
DEBUG_BUILD = "1"
EXTRA_IMAGE_FEATURES_append = " dbg-pkgs"
and potentially INHIBIT_PACKAGE_STRIP to control whether debug symbols should be kept with the binary or not. This may be necessary occasionally as some tools have problems reading .gnu_debuglink and therefore work only
with symbols included in the binaries.
Building and running with sanitizers #
WebKit works pretty well with all kinds of sanitizers. To build with any of them a CMake-level helper called ENABLE_SANITIZERS can be used by specifying -DENABLE_SANITIZERS=address, -DENABLE_SANITIZERS=leak etc. With that, the command for
building e.g. on desktop could look like:
./Tools/Scripts/build-webkit --wpe --debug --cmakeargs=-DENABLE_SANITIZERS=address.
For more details, one can refer to this article from fellow Igalian, Fujii.
Building and running with memory sampler #
When WPE is built with -DENABLE_MEMORY_SAMPLER=ON, the simple memory sampler can be started along with the browser using environment variable:
WEBKIT_SAMPLE_MEMORY=1(accompanied byWEBKIT_DISABLE_SANDBOX_THIS_IS_DANGEROUS=1if needed).
With that, the memory of various WPE processes is sampled every second, and saved to the files under /tmp directory continuously.
Building and running with node statistics #
Node statistics are a debug-only feature that can be enabled by:
- changing
0of#define DUMP_NODE_STATISTICS 0to1inSource/WebCore/dom/Element.h, - adding
dumpStatistics()call, to e.g.Nodeconstructor inSource/WebCore/dom/Node.cpp.
Building and running with libpas statistics #
Libpas statistics are a debug-only feature that can be enabled by changing 0 of #define PAS_ENABLE_STATS 0 to 1 in Source/bmalloc/libpas/src/libpas/pas_config.h and then running WPE with environment variable PAS_STATS_ENABLE=1.