Tracking WebKit's memory allocations with Malloc Heap Breakdown
One of the main constraints that embedded platforms impose on the browsers is a very limited memory. Combined with the fact that embedded web applications tend to run actively for days, weeks, or even longer, it’s not hard to imagine how important the proper memory management within the browser engine is in such use cases. In fact, WebKit and WPE in particular receive numerous memory-related fixes and improvements every year. Before making any changes, however, the areas to fix/improve need to be narrowed down first. Like any C++ application, WebKit memory can be profiled using a variety of industry-standard tools. Although such well-known tools are really useful in the majority of use cases, they have their limits that manifest themselves when applied on production-grade embedded systems in conjunction with long-running web applications. In such cases, a very useful tool is a debug-only feature of WebKit itself called malloc heap breakdown, which this article describes.
Industry-standard memory profilers #
When it comes to profiling memory of applications on linux systems, the 2 outstanding tools used usually are Massif (Valgrind) and Heaptrack.
Massif (Valgrind) #
Massif is a heap profiler that comes as part of the Valgrind suite. As its documentation states:
It measures how much heap memory your program uses. This includes both the useful space, and the extra bytes allocated for book-keeping and alignment purposes. It can also measure the size of your program’s stack(s), although it does not do so by default.
Using Massif with WebKit is very straightforward and boils down to a single command:
Malloc=1 valgrind --tool=massif --trace-children=yes WebKitBuild/GTK/Debug/bin/MiniBrowser '<URL>'
- The
Malloc=1environment variable set above is necessary to instruct WebKit to enable debug heaps that use the system malloc allocator.
Given some results are generated, the memory usage over time can be visualized using massif-visualizer utility. An example of such a visualization is presented in the image below:
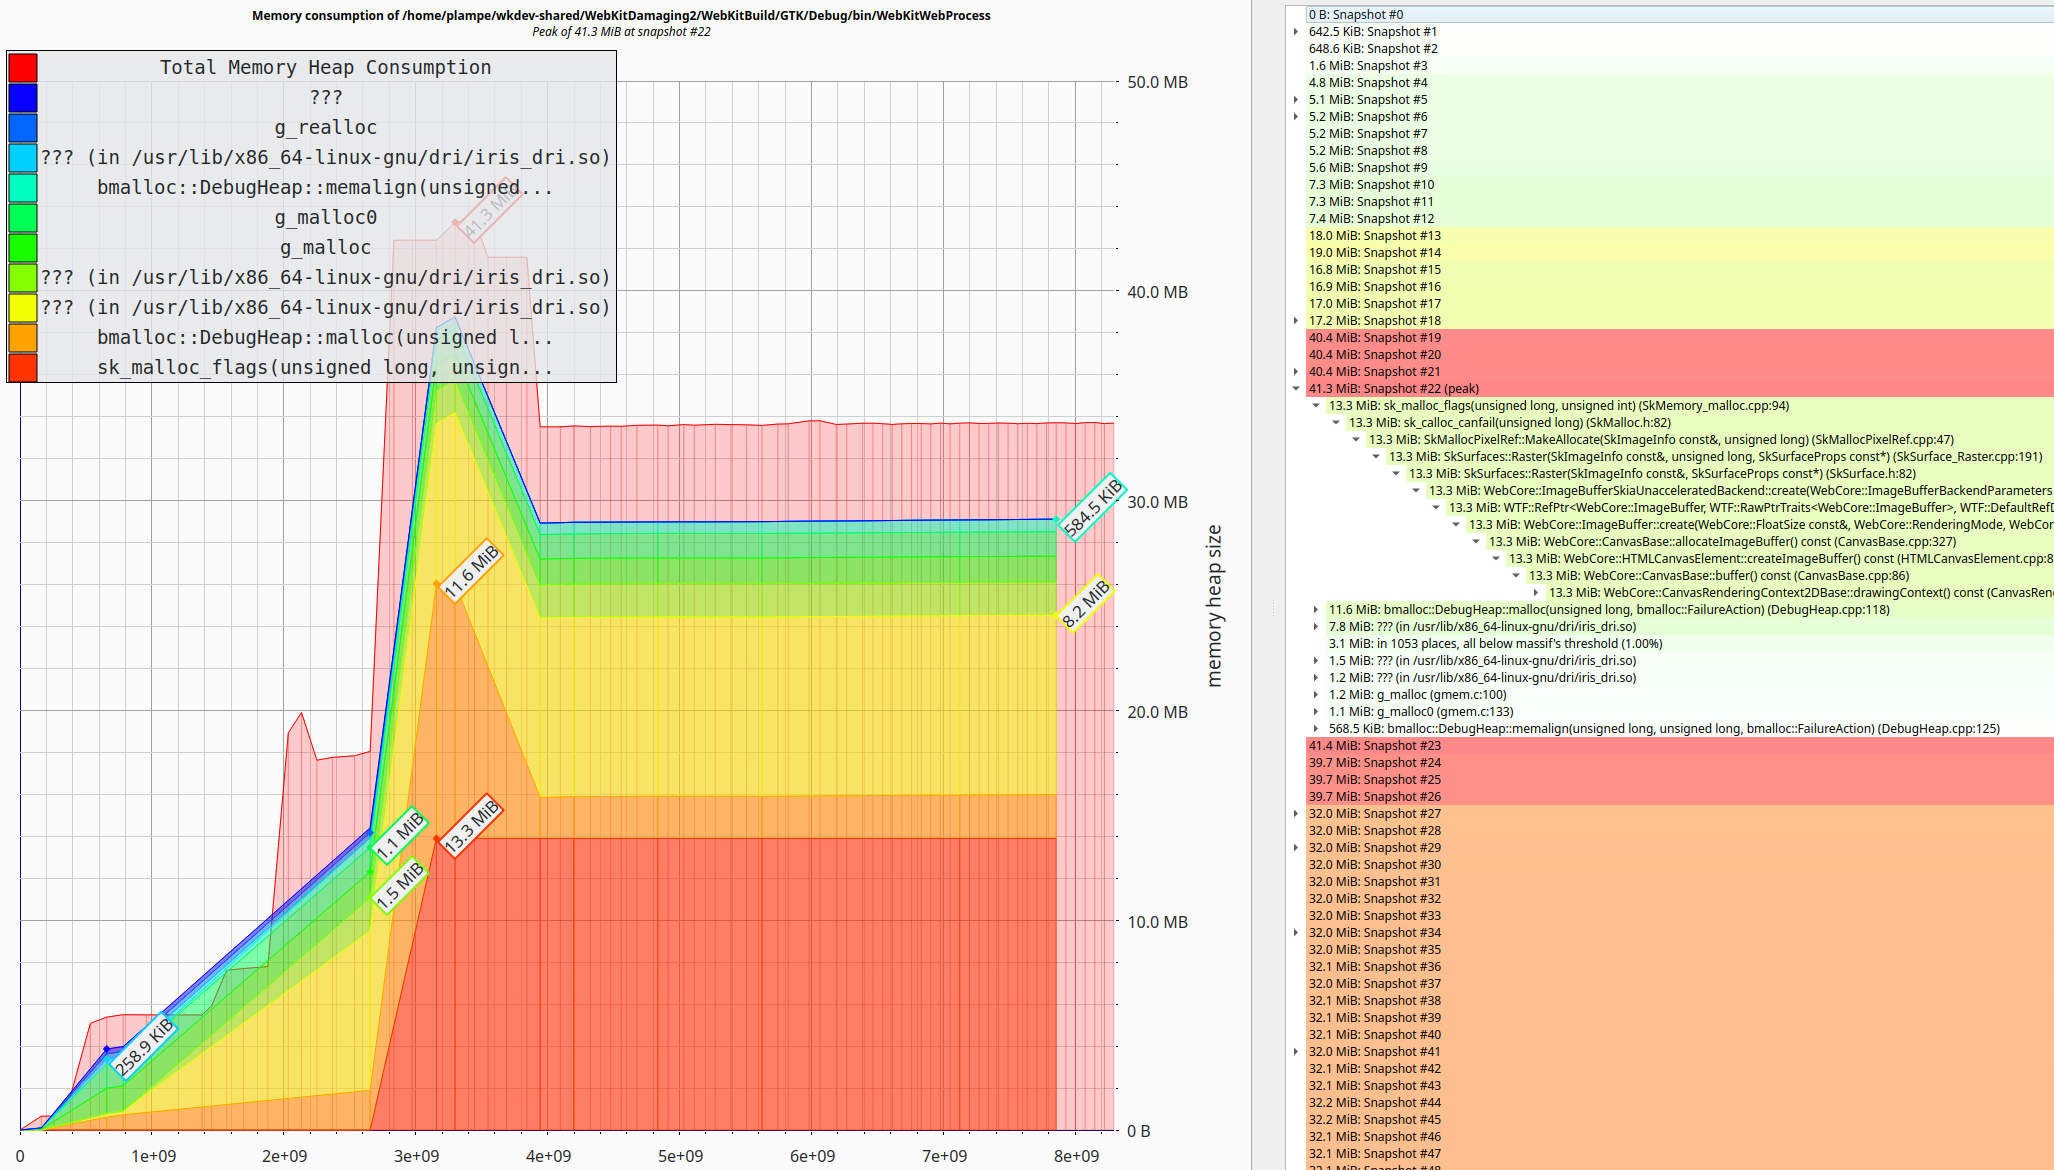
While Massif has been widely adopted and used for many years now, from the very beginning, it suffered from a few significant downsides.
First of all, the way Massif instruments the profiled application introduces significant overhead that may slow down the application up to 2 orders of magnitude. In some cases, such overhead makes it simply unusable.
The other important problem is that Massif is snapshot-based, and hence, the level of detail is not ideal.
Heaptrack #
Heaptrack is a modern heap profiler developed as part of KDE. The below is its description from the git repository:
Heaptrack traces all memory allocations and annotates these events with stack traces. Dedicated analysis tools then allow you to interpret the heap memory profile to:
- find hotspots that need to be optimized to reduce the memory footprint of your application
- find memory leaks, i.e. locations that allocate memory which is never deallocated
- find allocation hotspots, i.e. code locations that trigger a lot of memory allocation calls
- find temporary allocations, which are allocations that are directly followed by their deallocation
At first glance, Heaptrack resembles Massif. However, a closer look at the architecture and features shows that it’s much more than the latter. While it’s fair to say it’s a bit similar, in fact, it is a significant progression.
Usage of Heaptrack to profile WebKit is also very simple. At the moment of writing, the most suitable way to use it is to attach to a certain running WebKit process using the following command:
heaptrack -p <PID>
while the WebKit needs to be run with system malloc, just like in Massif case:
WEBKIT_DISABLE_SANDBOX_THIS_IS_DANGEROUS=1 Malloc=1 WebKitBuild/GTK/Debug/bin/MiniBrowser '<URL>'
- If profiling of e.g. web content process startup is essential, it’s then recommended also to use
WEBKIT2_PAUSE_WEB_PROCESS_ON_LAUNCH=1, which adds 30s delay to the process startup.
When the profiling session is done, the analysis of the recordings is done using:
heaptrack --analyze <RECORDING>
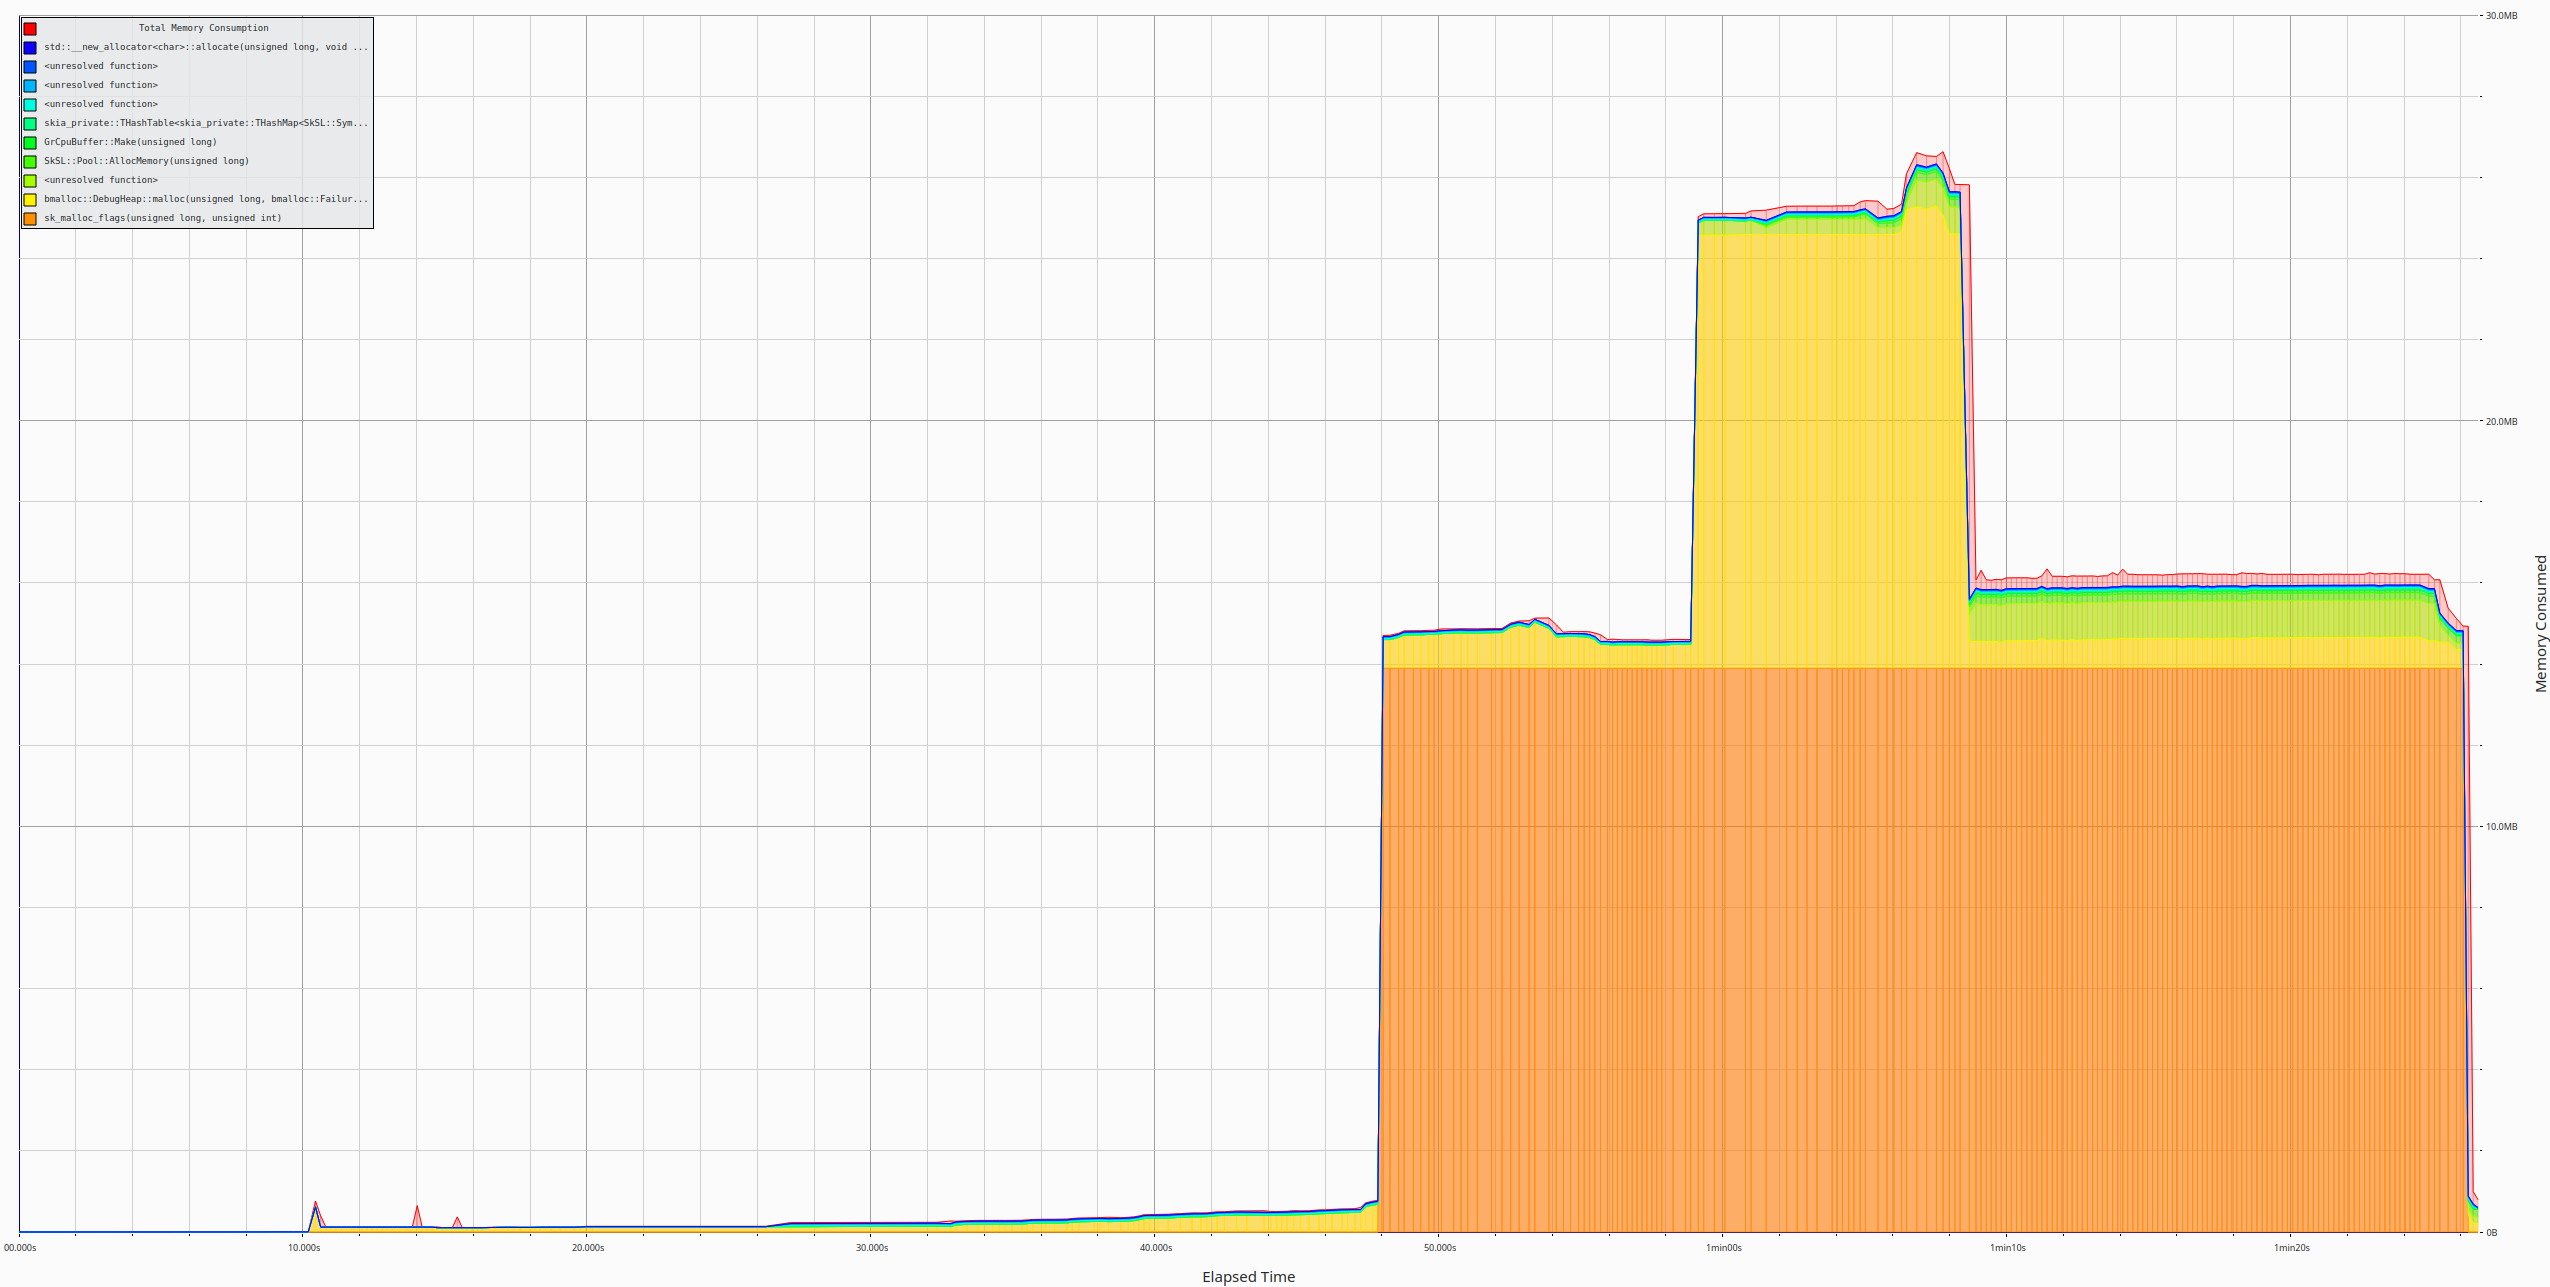
The utility opened with the above, shows various things, such as the memory consumption over time:
flame graphs of memory allocations with respect to certain functions in the code:
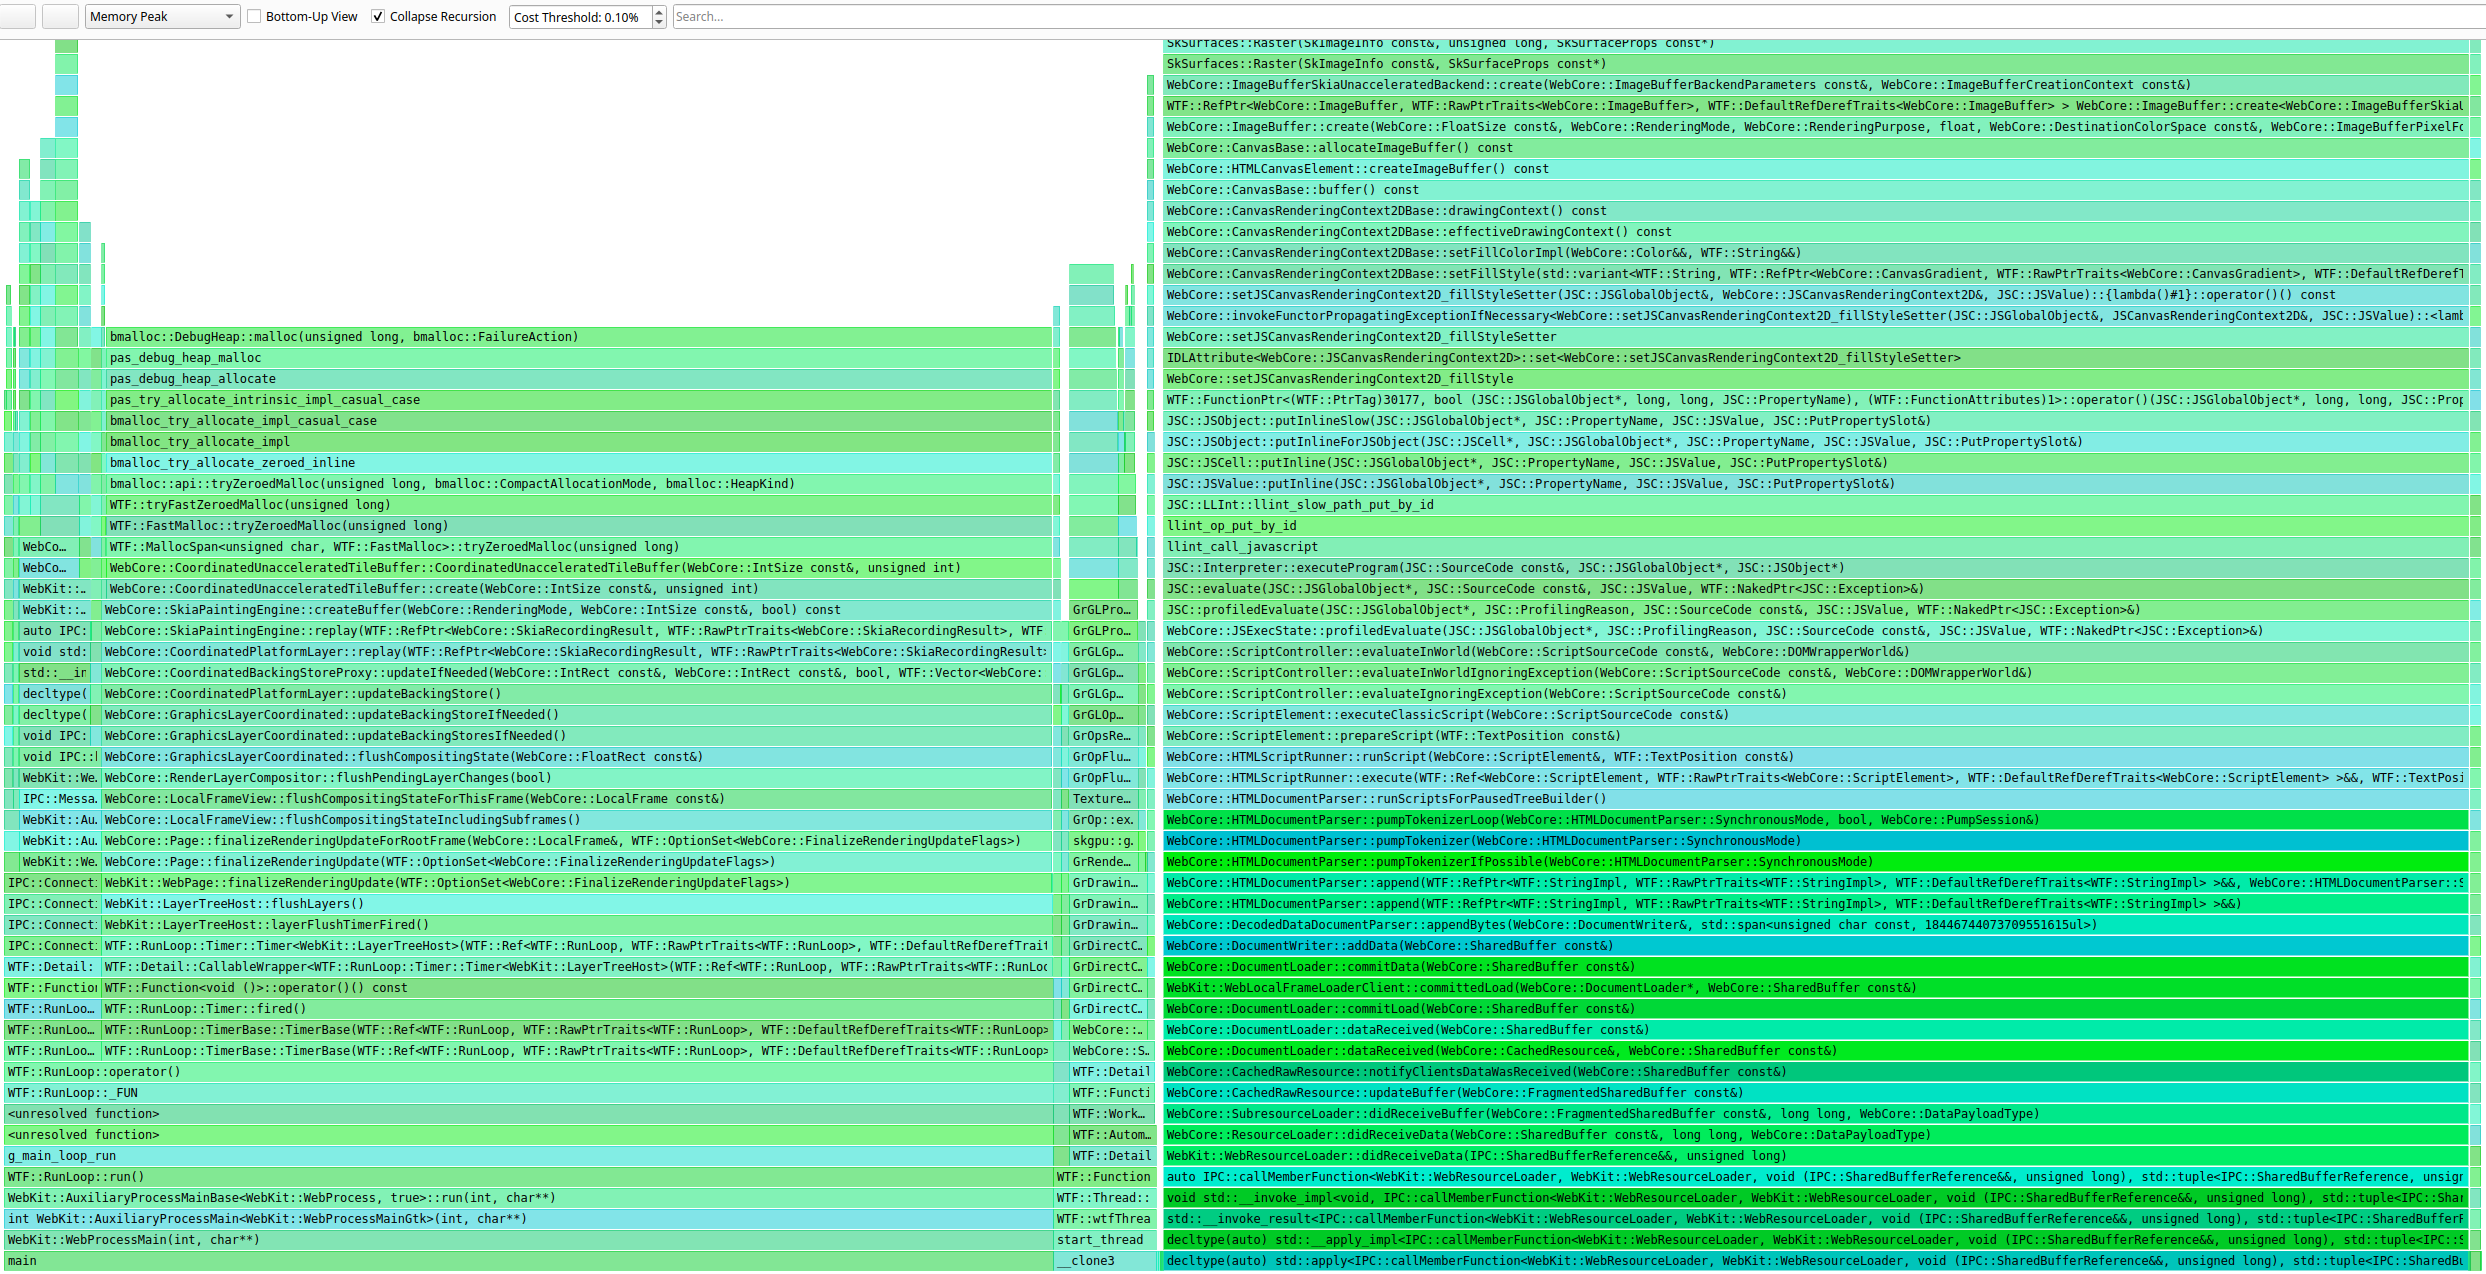
etc.
As Heaptrack records every allocation and deallocation, the data it gathers is very precise and full of details, especially when accompanied by stack traces arranged into flame graphs. Also, as Heaptrack does instrumentation differently than e.g. Massif, it’s usually much faster in the sense that it slows down the profiled application only up to 1 order of magnitude.
Shortcomings on embedded systems #
Although the memory profilers such as above are really great for everyday use, their limitations on embedded platforms are:
- they significantly slow down the profiled application — especially on low-end devices,
- they effectively cannot be run for a longer period of time such as days or weeks, due to memory consumption,
- they are not always provided in the images — and hence require additional setup,
- they may not be buildable out of the box on certain architectures — thus requiring extra patching.
While the above limitations are not always a problem, usually at least one of them is. What’s worse, usually at least one of the limitations turns into a blocking problem. For example, if the target device is very short on memory, it may be basically impossible to run anything extra beyond the browser. Another example could be a situation where the application slowdown due to the profiler usage, leads to different application behavior, such as a problem that originally reproduced 100% of the time, does not reproduce anymore etc.
Malloc heap breakdown in WebKit #
Profiling the memory of WebKit while addressing the above problems points towards a solution that does not involve any extra tools, i.e. instrumenting WebKit itself. Normally, adding such an instrumentation to the C++ application means a lot of work. Fortunately, in the case of WebKit, all that work is already done and can be easily enabled by using the Malloc heap breakdown.
In a nutshell, Malloc heap breakdown is a debug-only feature that enables memory allocation tracking within WebKit itself. Since it’s built into WebKit, it’s very lightweight and very easy to build, as it’s just about setting
the ENABLE_MALLOC_HEAP_BREAKDOWN build option. Internally, when the feature is enabled, WebKit switches to using debug heaps that use system malloc along with the malloc zone API
to mark objects of certain classes as belonging to different heap zones and thus allowing one to track the allocation sizes of such zones.
As the malloc zone API is specific to BSD-like OSes, the actual implementations (and usages) in WebKit have to be considered separately for Apple and non-Apple ports.
Malloc heap breakdown on Apple ports #
Malloc heap breakdown was originally designed only with Apple ports in mind, with the reason being twofold:
- The malloc zone API is provided virtually by all platforms that Apple ports integrate with.
- MacOS platforms provide a great utility called
footprintthat allows one to inspect per-zone memory statistics for a given process.
Given the above, usage of malloc heap breakdown with Apple ports is very smooth and as simple as building WebKit with the ENABLE_MALLOC_HEAP_BREAKDOWN build option and running on macOS while using the footprint utility:
Footprint is a macOS specific tool that allows the developer to check memory usage across regions.
For more details, one should refer to the official documentation page.
Malloc heap breakdown on non-Apple ports #
Since all of the non-Apple WebKit ports are mostly being built and run on non-BSD-like systems, it’s safe to assume the malloc zone API is not offered to such ports by the system itself. Because of the above, for many years, malloc heap breakdown was only available for Apple ports.
Fortunately, with the changes introduced in 2025, such as: 294667@main (+ fix 294848@main), 301702@main, and improvements
such as:
294848@main,
299555@main,
301695@main,
301709@main,
301712@main,
301839@main,
301861@main,
the malloc heap breakdown integrates also with non-Apple ports and is stable as of main@a235408c2b4eb12216d519e996f70828b9a45e19.
The idea behind the integration for non-Apple ports is to provide a simple WebKit-internal library that provides a fake <malloc/malloc.h> header along with simple implementation that provides malloc_zone_*() function implementations
as proxy calls to malloc(), calloc(), realloc() etc. along with a tracking mechanism that keeps references to memory chunks. Such an approach gathers all the information needed to be reported later on.
At the moment of writing, the above allows 2 methods of reporting the memory usage statistics periodically:
- printing to standard output,
- reporting to sysprof as counters.
Periodic reporting to standard output
By default, when WebKit is built with ENABLE_MALLOC_HEAP_BREAKDOWN, the heap breakdown is printed to the standard output every few seconds for each process. That can be tweaked by setting WEBKIT_MALLOC_HEAP_BREAKDOWN_LOG_INTERVAL=<SECONDS>
environment variable.
The results have a structure similar to the one below:
402339 MHB: | PID | "Zone name" | #chunks | #bytes | {
402339 "ExecutableMemoryHandle" 2 32
402339 "AssemblerData" 1 192
402339 "VectorBuffer" 37 16184
402339 "StringImpl" 103 5146
402339 "WeakPtrImplBase" 17 272
402339 "HashTable" 37 9408
402339 "Vector" 1 16
402339 "EmbeddedFixedVector" 1 32
402339 "BloomFilter" 2 65536
402339 "CStringBuffer" 3 86
402339 "Default Zone" 0 0
402339 } MHB: grand total bytes allocated: 9690
Given the allocation statistics per-zone, it’s easy to narrow down the unusual usage patterns manually. The example of a successful investigation is presented in the image below:
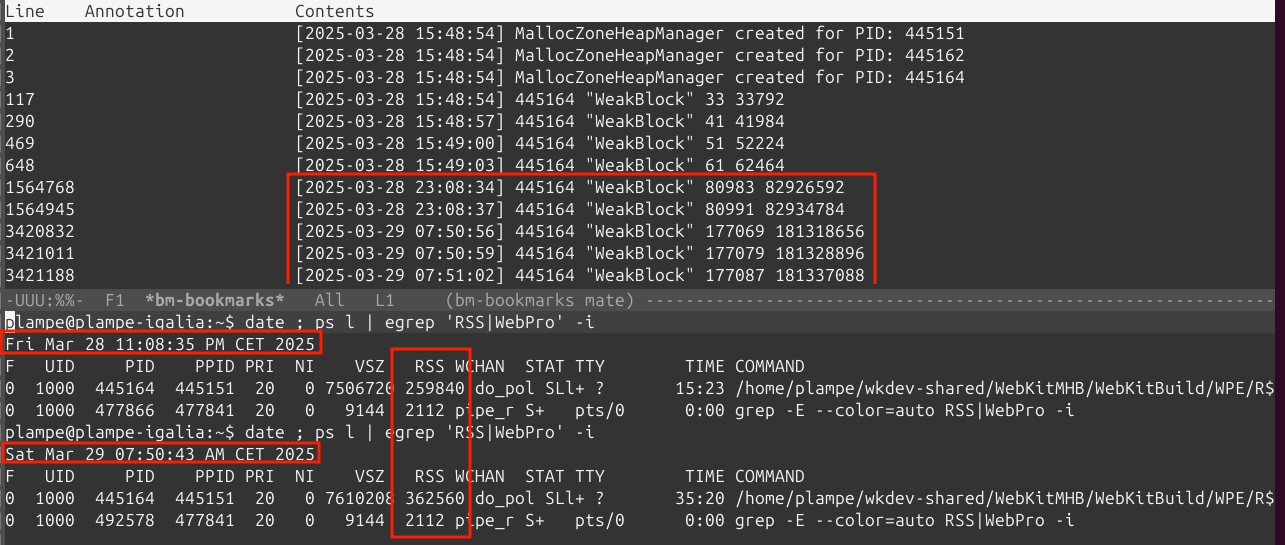
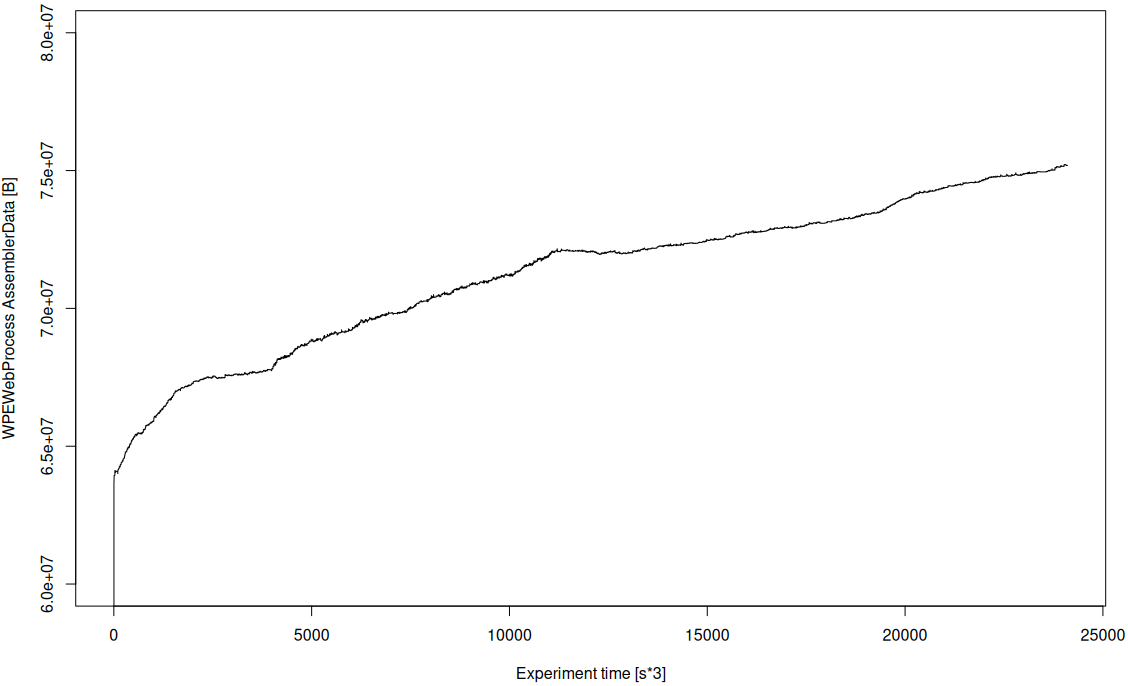
Moreover, the data presented can be processed either manually or using scripts to create memory usage charts that span as long as the application lifetime so e.g. hours (20+ like below), days, or even longer:
Periodic reporting to sysprof
The other reporting mechanism currently supported is reporting periodically to sysprof as counters. In short, sysprof is a modern system-wide profiling tool that already integrates with WebKit very well when it comes to non-Apple ports.
The condition for malloc heap breakdown reporting to sysprof is that the WebKit browser needs to be profiled e.g. using:
sysprof-cli -f -- <BROWSER_COMMAND>
and the sysprof has to be in the latest version possible.
With the above, the memory usage statistics can then be inspected using the sysprof utility and look like in the image below:
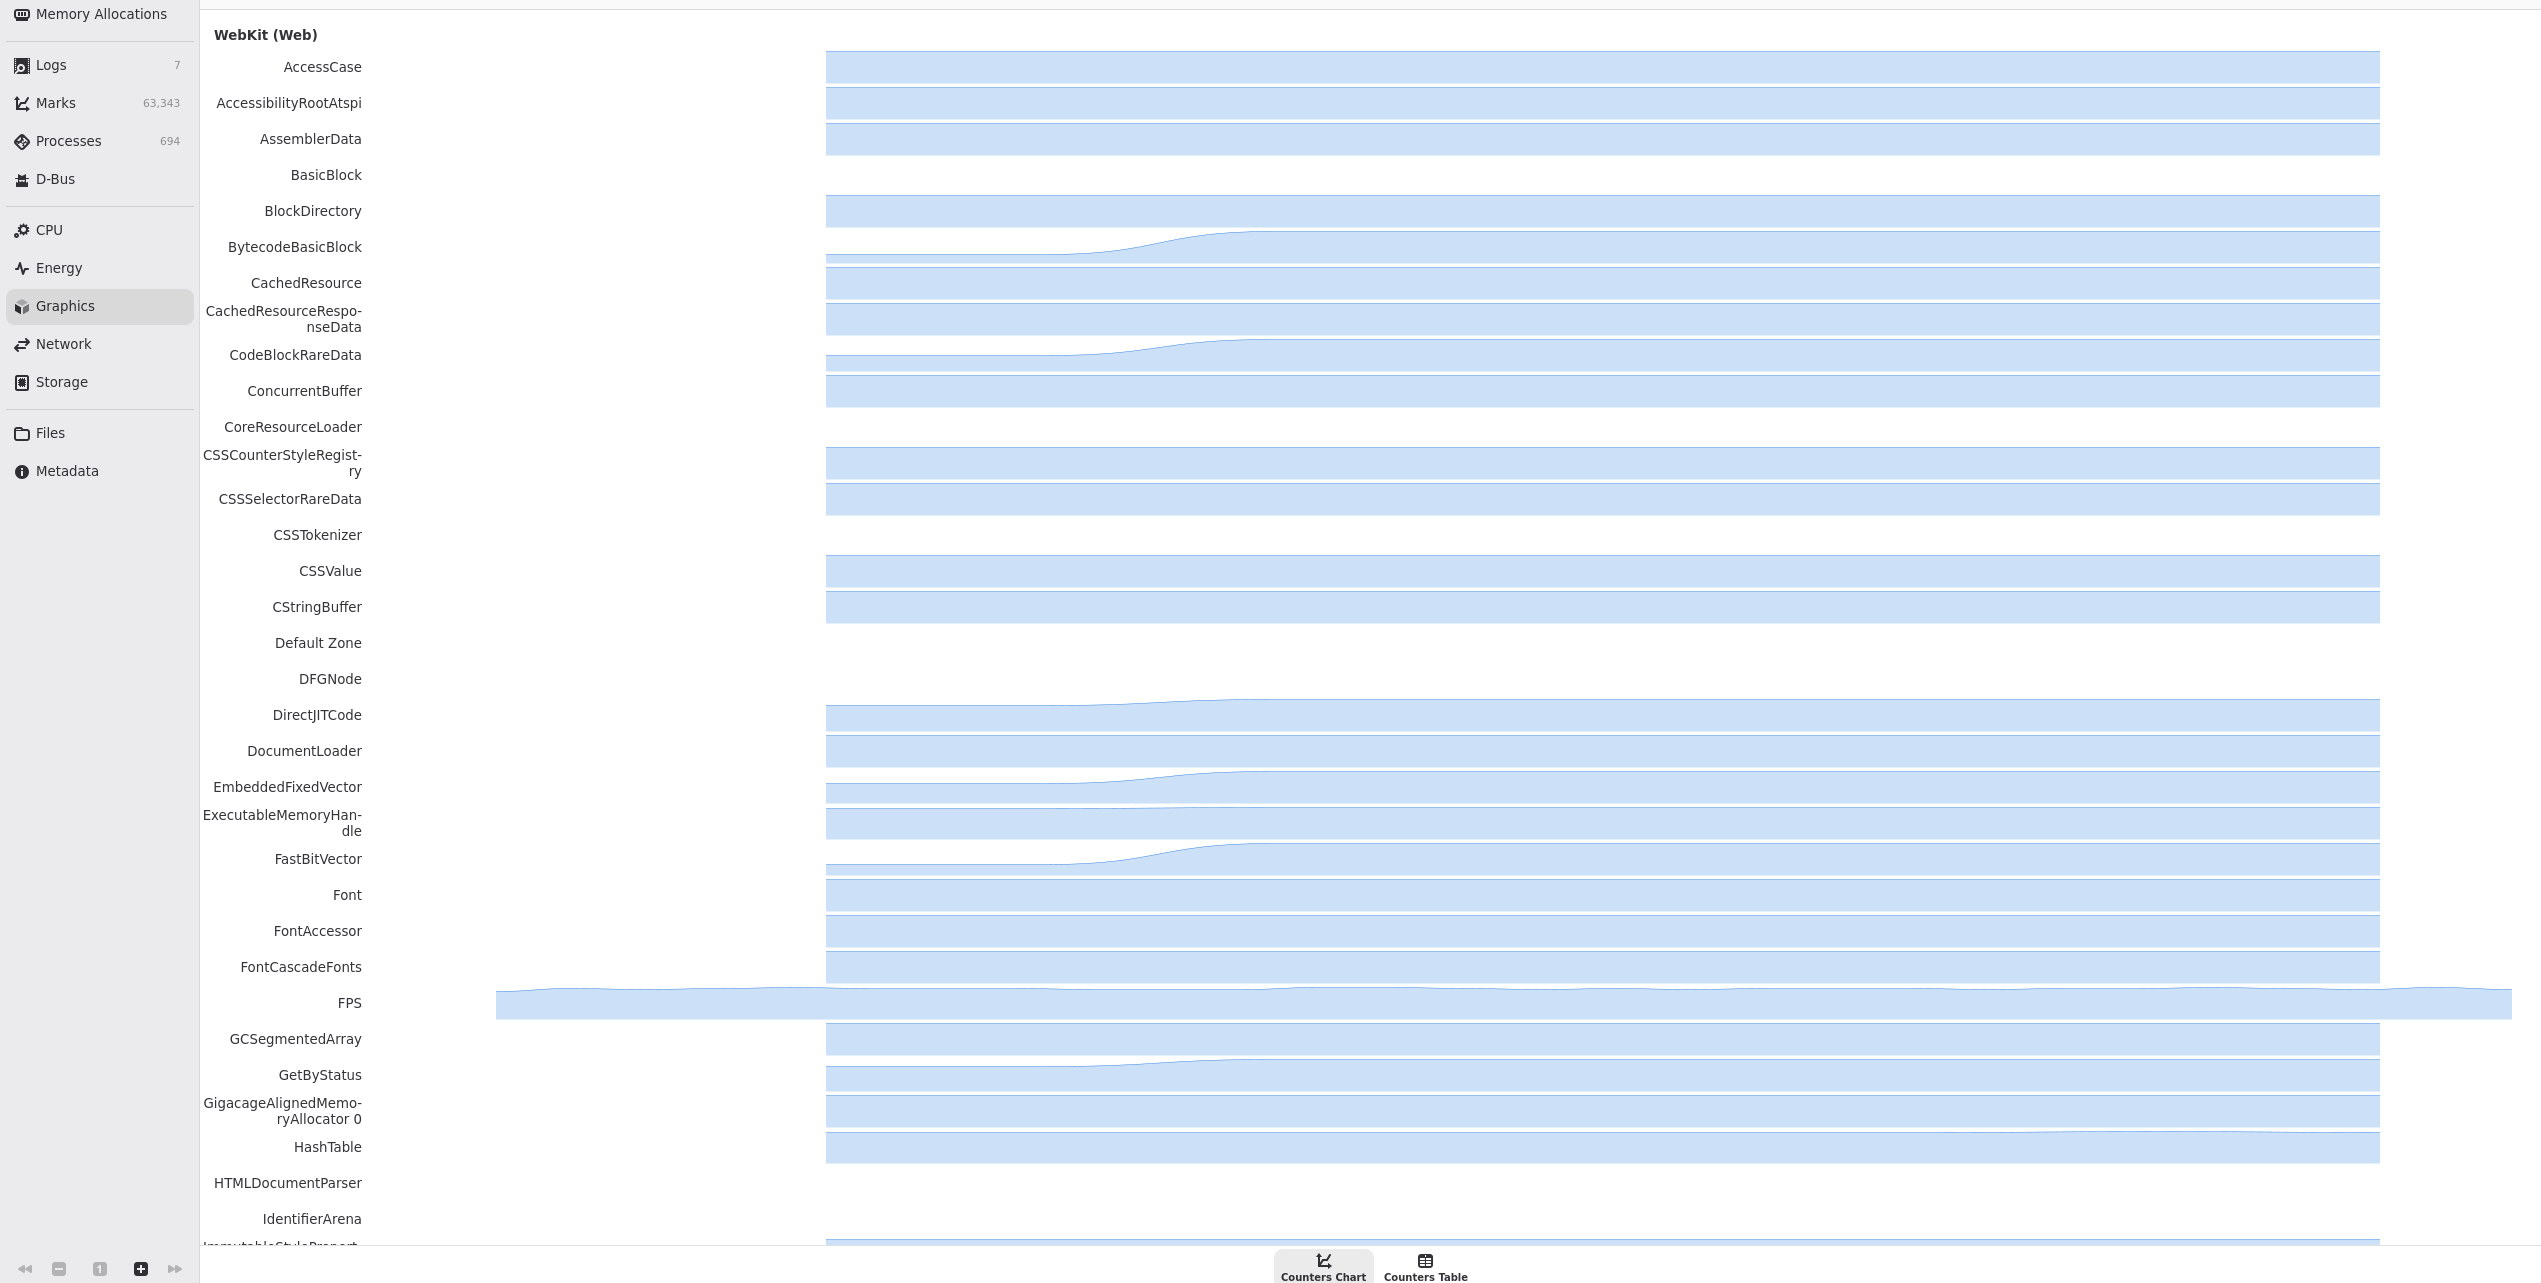
In the case of sysprof, memory statistics in that case are just a minor addition to other powerful features that were well described in this blog post from Georges.
Caveats #
While malloc heap breakdown is very useful in some use cases — especially on embedded systems — there are a few problems with it.
First of all, compilation with -DENABLE_MALLOC_HEAP_BREAKDOWN=ON is not guarded by any continuous integration bots; therefore, the compilation issues are expected on the latest WebKit main. Fortunately, fixing the problems
is usually straightforward. For a reference on what may be causing compilation problems usually, one should refer to 299555@main, which contains a full variety of fixes.
The second problem is that malloc heap breakdown uses WebKit’s debug heaps, and hence the memory usage patterns may be different just because system malloc is used.
The third, and final problem, is that malloc heap breakdown integration for non-Apple ports introduces some overhead as the allocations need to lock/unlock the mutex, and as statistics are stored in the memory as well.
Opportunities #
Although malloc heap breakdown can be considered fairly constrained, in the case of non-Apple ports, it gives some additional possibilities that are worth mentioning.
Because on non-Apple ports, the custom library is used to track allocations (as mentioned at the beginning of the Malloc heap breakdown on non-Apple ports section), it’s very easy to add more sophisticated tracking/debugging/reporting capabilities. The only file that requires changes in such a case is: Source/WTF/wtf/malloc_heap_breakdown/main.cpp.
Some examples of custom modifications include:
- adding different reporting mechanisms — e.g. writing to a file, or to some other tool,
- reporting memory usage with more details — e.g. reporting the per-memory-chunk statistics,
- dumping raw memory bytes — e.g. when some allocations are suspicious.
- altering memory in-place — e.g. to simulate memory corruption.
Summary #
While the presented malloc heap breakdown mechanism is a rather poor approximation of what industry standard tools offer, the main benefit of it is that it’s built into WebKit, and that in some rare use-cases (especially on embedded platforms), it’s the only way to perform any reasonable profiling.
In general, as a rule of thumb, it’s not recommended to use malloc heap breakdown unless all other methods have failed. In that sense, it should be considered a last resort approach. With that in mind, malloc heap breakdown can be seen as a nice mechanism complementing other tools in the toolbox.