If you follow closely the LibrePlan project, you will know that we are working in the development of the features that will be included in the LibrePlan 1.3 version, that is estimated to be released next April (you can look into the roadmap here).
Among the things included in the roadmap, we regarded as very interesting to work in making the tool more intelligent by providing a set of indicators informing about the status of the project. At present, of course, you can also know the status of a project examining the planning and extracting the reports existing in LibrePlan. However, we thought that we could go one step further.
We realized that although monitoring and controlling the project plan can be done by the project manager quite fast and easy, there is a user role, different from the project manager, that is also very interested in the status of the company projects. This user can be defined as an employee with a chief position in the organization hierarchy. For instance, the CEO of a company can be a good prototype of this sort of profile.
This profile has some characteristics that make him different from the project manager role:
- The CEO is a user with less project management knowledge than the project manager and, therefore, has more difficulties in analyzing the project Gantt, in interpreting correctly the progress measurements or in applying project management techniques like the EVM (Earned Value Management) and the Monte Carlo simulation implemented in LibrePlan.
- The CEO is a user whose main duties are not related with project management and, because of this, he has less time available to follow the day a day of the projects opened in the company.
- Although the CEO has both less project management knowledge and less time to devote to it, he is interested in knowing how well or bad is going a project to make executive decisions if required.
So, taking into account the above points, we assessed that for this kind of chief employee could be very useful a set of metrics, usually called KPI (Key Performance Indicators). Project management KPIs measure how well a project is performing according to its goals and objectives, i.e., to finish on time and with the expected cost.
KPIs are perfect for the CEO users because they have three properties that satisfy the needs and use pattern of these executive users:
- They sum up information. They gather planning data and through calculations provide a panoramic view of the situation of a project according to the specific goal aspect they are are designed to measure.
- They are easy to understand. They do not require a lot of project management background to be read. Besides, in LibrePlan they can be merged to provide a single verdict about a project.
- They are fast. The user is not required to spend much time with the project plan to be able to get a view about the status of the project.
I would like also to highlight that, although they are very important for the chief employees, the KPIs are also very helpful for the project managers and all the people taking part in the planning because they save time and provide and a good picture of the status of the project at any moment.
The KPIs will be displayed in LibrePlan 1.3 in a screen of the project planning that will be called the dashboard. With this name we are drawing an analogy with physical dashboards present in complex machines like, for example, a plane where the pilots have a flying deck with a bunch of sensors monitoring any single aspect of the flight. In the same way, in the LibrePlan dashboard, the person in charge of the planning will be able to look at a set of numerical data and charts that will help him to bring the project to fruition.
We have been studying which KPIs to implement to launch the first version of the dashboard and the principles we have followed in the research have been two: to cover the relevant aspects of the status of a project and, second, to maximize the value added to the program.
Once concluded this investigation process, the result has been the identification of four dimensions and a set of KPIs per dimension. Besides, according to this four dimensions, we designed the layout of the dashboard divided in four areas, each one containing the KPIs belonging to it inside.
The dimensions and KPIs are the next ones:
Progress
This dimension measures which is the progress degree of the project, i.e, work already done versus work remaining to do to close the project. KPIs:
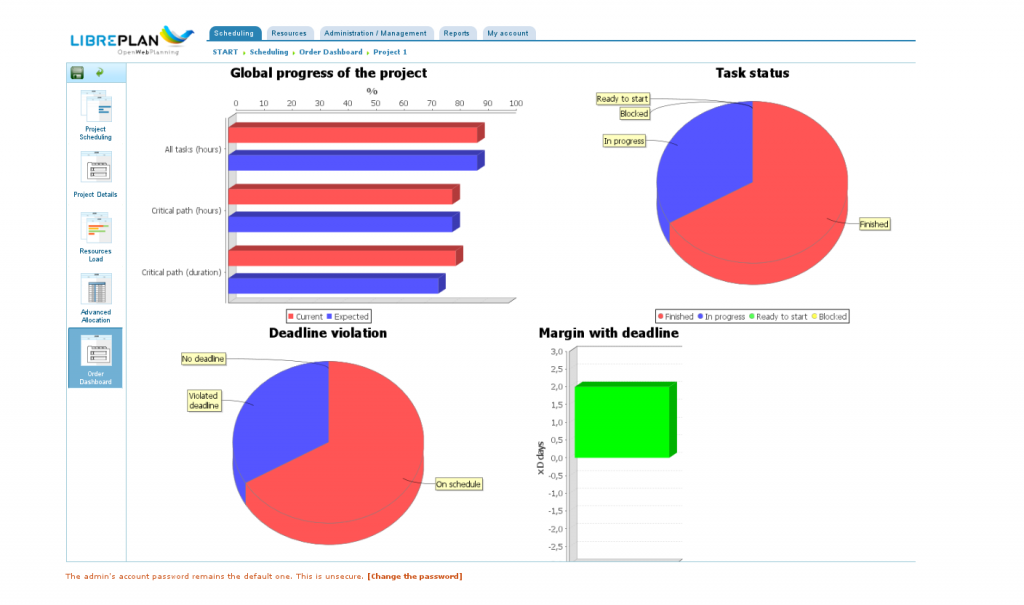
- Global progress chart. It will sum up the current global progress of the project and will show the theoretical value the project progress should have if all things went as expected.
- Task status chart. It will show the number of tasks finished, ready to start, blocked by a previous dependent task, etc..
Time
This area will show how well the project is performing in time according to deadlines and other time commitments. KPIs:
- Task completion delay histogram. It will show an histogram chart with the number of days the tasks of the project are finishing ahead of time or after the planned end date.
- Deadline violation KPI. Pie chart with the tasks which have not hit the deadline, the tasks which have hit it and the tasks without a configured one.
- Margin with project deadline. Number of days the project finishes after or before the configured project deadline.
Resources
This dimension will do an analysis of the resources being allocated in the project. KPIs:
- Estimation accuracy histogram. It will be an histogram with the deviation between the hours planned and the hours finally devoted by the company resources to the tasks of the project.
- Overtime ratio. It will show how much overtime the resources allocated to the project are having.
Cost
This area will include some metrics belonging to the EVM technique. These metrics are function of time and in this area will be shown calculated at the current date. KPIs:
- Cost Variance. It will be the difference between the BCWP (Budgeted Cost Work Performed) and the ACWP (Actual Cost Work Performed). It says how much we are losing or winning regarding to the estimated cost planned.
- Cost Performance Index. It informs about the current rate of win/loss value per time unit.
- Estimated as Completion (EAC). It is a projection that estimates which will be the final project cost at completion.
- Varience at Completion. It is a projection of the estimated benefit or loss at completion time.
And finally, as a picture is worth a thousand words, although the dashboard is work in progress, I would like to include here a snapshot of some KPIs mentioned above that the LibrePlan team is implementing currently.

Besides, as we usually do, if you want to share with us your ideas or requests about what KPIs you miss or things that you regar as important for future, just let us know about it using the communication resources we have available in LibrePlan.


