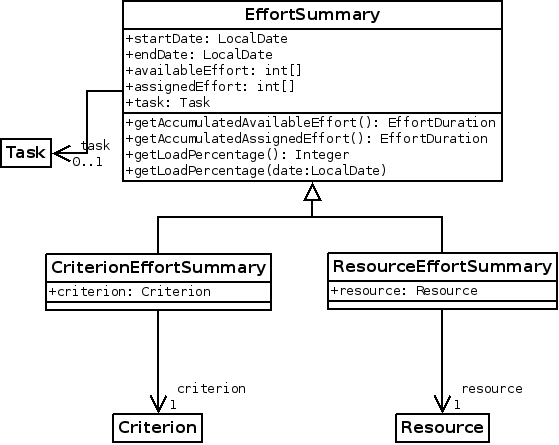
Allocations of resources to projects and tasks are probably the most complex information we have in LibrePlan. There are multiple types of allocations, many related entities and a high granularity, which basically means there are a lot of data and queries are complex. At the same time, these data are very valuable to see the state of the company, for example through the different resource load charts.

We have been working on a custom model to provide a more direct, faster access to these data. As you could expect, it is a really simple model: there is one row per resource or criterion and task, which will contain all the corresponding time allocated to that resource/task or criterion/task pair. To be able to have every pair in a single row, the allocation information is stored in a serialized array. There is also another row to store all the allocation information for every resource or criterion, to prevent having to retrieve more than one row to get the global allocation information of a resource or criterion. Of course, there is a lot of duplicated or redundant information in this model, but it’s done for the sake of performance.
With all these elements in place, building the resource load screen becomes easier, and what’s more important, a lot faster: our tests with 1000 tasks and 50 projects revealed that the time to build the global resource load diagram decreased from 30 seconds to only 2 seconds in average. It’s more than ten times faster!
There are still challenges that have to be beaten before these improvements can reach a production release, the most important one is keeping the new data model synchronized and updated. Until then, anybody can play with the new code in the branch resource-load-performance.

