Presenting kdumpst, or how to collect kernel crash logs on Arch Linux

It’s been a long time since I last posted something here – yet there are interesting news to mention, a bit far from ARM64 (the topic of my previous posts). Let’s talk today about kernel crashes, or even better, how can we collect information if a kernel panic happens on Arch Linux and on SteamOS, the Linux distribution used on the Steam Deck. First all, it’s worth mentioning some ambiguity in the terms used here. Usually “kernel panic” and “crash” (or even “oops”) are terms used as synonymous, though this is not entirely true. A kernel oops is the error state faced by the kernel in case it finds a bad condition; some usual conditions that lead to oopses are null pointer dereference, specially due to concurrency issues (like bad locking) or user-after-free / out-of-bounds accesses. BUG() statements in the code and rogue DMA access (due to driver or HW issues) are also a common cause. A kernel panic, on the other hand, is the action the kernel takes once an oops is detected – and in most cases, the system is typically rebooted as a consequence of these errors. Another possible action, though, is to configure the system to attempt a log collection in the face of these issues, in order to have a post-mortem investigation, after a reboot to clean state. And that is where technologies like kdump and pstore come in handy!

Pstore x Kdump – pros and cons

Pstore is a mechanism to have the kernel write some information in a persistent storage backend. The most common scenario is to write the dmesg after an oops condition to the pstore backend, which could be the RAM, a UEFI variable, or even a block device. There are other backends (ACPI ERST tables, for example) and other frontends as well, like the console or ftrace ring buffer, though they’re out of the scope of this introductory post. Kdump on the other hand is a technology in which the kernel jumps to a new kernel (called “crash kernel”) when some (user-configurable) condition is observed, like an oops. The “jump” to the new kernel happens through the kexec kernel mechanism, bypassing the FW initialization, so the crash kernel has complete visibility of the state of the old, “broken” kernel, and is able to collect not only logs, but the full memory image, called vmcore. Such memory image could be trimmed to remove userspace data and free pages, and it is usually compressed. All of that is configurable, and the details will be discussed in a future blog post. So, what is the best option? Which one, between pstore and kdump, should be used? As usual in computing (and for everything in life, usually), it depends. The trade-offs here are related to risks involved, which differ between kdump and pstore, the amount of information you want to collect (hence, store!) and the memory / time resources one is willing to spend on that.
Starting with the resources: kdump requires the kernel to pre-reserve a fixed amount of RAM, that’s never used by the system, regardless of oopses – and that amount is non-trivial, specially for embedded or any low-resource system, lying in the range of 150-250MB for newer kernels. As per the data collected, of course kdump is capable of collecting more information, in the form of the vmcore, but even compressed, the data might be multiple GBs, while a compressed kernel dmesg (that can be enhanced with some extra information, detailed below) is in the order of kBs, maybe a few MBs tops. Finally, the risks are present in both pstore and kdump, though they differ a bit: kdump relies on kexec, which is a fast reboot mechanism that bypasses the FW, for the good and the bad. Kexec is for sure faster and more lightweight than a full firmware reboot, but at the same time, we don’t have a standard protocol for PCIe HW resetting, specially on more common architectures like x86 and ARM, so we need to rely on drivers to proper restart the devices; this may lead to issues in the boot time of the crash kernel, or to HW malfunctioning in such kernel, that could incur in a lost opportunity to collect logs, if the storage device doesn’t work fine without a FW reboot, for example, causing the vmcore saving step to fail. From the pstore perspective, the mechanism relies on having the broken kernel to write logs to a persistent storage, so this is inherently unsafe; also, backends may be tricky to deal with, the RAM case being very emblematic. Lots of FW implementations either retrain or just purely corrupt the RAM on boot process, so pstore logs saved to RAM might be useless in some systems. UEFI variables are more stable and should be really persistent, but your mileage may vary: some UEFI implementations may not behave properly, or there may be almost no free space to store even a small dmesg in the UEFI area. All in all, it’s a matter of considering the trade-offs and experimenting. I’ve made a presentation about this topic in the Linux Plumbers 2023, so for the interested readers I suggest you to take a look in the recording! Now, for the sake of experimenting, here comes the kdumpst tool: an automatic log collection tool for Arch Linux and SteamOS that relies on both pstore and kdump!

Presenting kdumpst

Most common Linux distros come with a kdump tool, like kdump-tools for Debian (and Ubuntu), Fedora’s kdump, etc. Arch Linux, on the other hand, is missing some high level utility; the Arch wiki even recommended a manual process for collecting kernel core dumps, setting everything up “by hand”. The lack of tooling is especially felt on SteamOS, the distribution used by Valve’s Steam Deck, which is a port of Arch Linux. An interesting, and important, feature for SteamOS is the ability to collect logs or any information in case of a kernel crash; but how to ponder and choose between kdump or pstore? The Steam Deck has a powerful HW, but “spending” ~250MB of RAM in every boot just to set kdump seems an overkill; so why not take advantage of both? Well, that’s exactly the purpose of kdumpst: to enable users to have a choice and determine in a case-by-case fashion what’s the level of information they wish to have in case of a kernel crash – the more information is desired (a vmcore being the gold standard), the more resources are required for that. So, kdumpst by default relies on pstore’s RAM backend (though the UEFI backend is under implementation), but users can change it to kdump mode, so it will pre-reserve some RAM memory and load the crash kernel. The tool also makes use of some sysctl tunings to panic and reboot under some circumstances (oops, hard lockups, etc) and dump extra information on dmesg, like tasks’ state and memory information (through the panic_print tuning) – all of that part of kdumpst custom settings, which can be easily changed by the user.
I plan more detailed blog posts to describe the pstore mechanism and how to use it with kdumpst (and even some tricks out of the tool’s scope), and the same for the kdump facility. But it is worth to give here some hints on how to make use of the tool and explore its capabilities on Arch Linux, a “crash course” let’s say :-]

Set-up and experimenting with kdumpst

First of all, you should get the kdumpst package from the AUR and install it. After that, you must enable and start its service, by running systemctl enable --now kdumpst-init . The default mode of operation for kdumpst is based on pstore with RAM backend, so naturally it’ll try to find a region of memory unused by the kernel. It’s not super common to have a region without allocating it previously, but sometimes due to x86 alignment, or a device-tree setting on ARM boards, it might be available. If pstore is properly set, a message like the following would show up in the systemd journal:kdumpst: pstore-RAM was loaded successfully.
You can check that using the command: journalctl -b | grep kdumpst. If pstore RAM mode fails, the tool will automatically attempts kdump, and the following 2 messages should be present in the logs:

kdumpst: kexec won't succeed, no reserved memory in this boot…
kdumpst: but we automatically set crashkernel for next boot.

This is expected, since the crash kernel memory allocation requires to be done on boot time. So kdumpst will automatically set the command-line (GRUB only, for now), and on next boot, the following message should be present in the journal:
kdumpst: panic kexec loaded successfully. In both cases (pstore or kdump), if the logs report that kdumpst loaded successfully, the system should be ready for collecting the kernel log in case of a crash event. Testing isn’t a bad idea, so how about triggering a “fake” panic to verify? For that, the next 2 commands should do the trick (run them as root user):
echo 1 > /proc/sys/kernel/sysrq
echo c > /proc/sysrq-trigger Be aware that these commands will cause a kernel panic, potentially leading to data corruption, so better to run it on an idle system!

The effect should be a reboot; when the system finishes the initialization process, the following entry should be present in the journal:

kdumpst: logs saved in "/home/.steamos/offload/var/kdumpst/logs"

That means the tool is properly configured and working, and collected the logs. A zip archive will be present in such directory, containing (among other files) a dmesg of the crash, with some extra information. In case you want to tune the configurables of kdumpst, just take a look in its configuration file, at /var/share/kdumpst.d/00-default – one can set various options there, like the default mode (pstore/kdump), the amount of reserved memory for kdump, the directory used to store the logs, record size of pstore, etc. Another configuration file that may be interesting is the sysctl one, at /usr/lib/sysctl.d/20-panic-sysctls.conf, which can be used to fine tune the panic actions for the kernel. So, hopefully, this short introduction has been helpful for Arch Linux users to start experimenting with kdumpst. If you find any issue, have a suggestion for some improvement, or even submit a contribution, feel free to open an issue in the kdumpst gitlab repo. Thanks for reading and see you soon in the next posts about pstore and kdump!

Debugging early boot issues on ARM64 (without console!)

In the last blog post, about booting the upstream kernel on Inforce 6640, I mentioned that there was an interesting issue with ftrace that led to a form of debug-by-rebooting approach, and that is worth a blog post. Of course it only took me 1 year+ to write it (!) – so apologies for this huge delay, and let’s debug some early boot failures! First of all, a reminder of what was the issue: in an attempt to boot the upstream kernel on the Inforce 6640 board, I found that for some reason ftrace doesn’t work in such a setup, starting around kernel 5.7 – bisect wasn’t precise, even talking with the ftrace maintainer on IRC didn’t provide many clues (since more debugging was required). In order to be accurate and provide up-to-date results, I re-tested this with kernel v6.2-rc7 and…same issue is observed, the kernel just can’t boot with ftrace, and not a single hint is provided in serial console! A parenthesis here: kernel 6.2-rc7 does boot on inforce 6640, but with no graphics (likely some changes in the msm driver), having some SCSI timeouts on boot time (sd 0:0:0:0: [sda] tag#13 timing out command, waited 120s) and…no USB(!), unless the “old” device-tree (from v5.16) is used – I think it’s related with some dwc3/usb changes merged on qcom device-trees. But anyway, this might be a topic for a whole new blog post, so let’s get back to debugging early boot issues. Once we face a completely empty serial output after the usual bootloader messages, a basic question comes up: has the kernel even booted? In other words, more technically meaningful: did the bootloader properly load the kernel and jump to the code? Did the kernel code effectively start execution? The first idea is always “let’s print something”, but how, if I don’t know where I’d put the print statement? Not to mention…that super early code has nothing initialized, so even a printk could be “too much” for such code. Hence, the only alternative seemed to me…to reboot the machine from kernel code! With that, at least I’d validate that kernel code was running. And thinking about that…I even extended this logic: if I can reboot the kernel, I could kinda bisect the code to determine where the failure is. One question remains though – how to reboot a kernel so early? Rebooting/shutdown is definitely a non-trivial task. By checking the kernel code (here, for example), one can see it’s full of callbacks to the architecture code; naturally, it’s a platform/arch low-level process. Checking machine_restart() under arch/arm64, we can see it goes through EFI calls (if EFI is supported). Noticing I was walking an unknown and potentially daunting path, the decision was to first seek help on IRC, and that brought me gold: Marc Zyngier (the ARM64 maintainer) presented me PSCI (Power State Coordination Interface) – if my device’s firmware supports this specification (and Inforce 6640 does!), I could issue a PSCI reset SMC (Secure Monitor Call) to get a board reset. In other words, with some assembly instructions I could perhaps reboot the kernel! Marc even provided me information about the register I should write, and after some tinkering (and more code study), I came up with this function:
static inline void arm64_smc_reset(void)
{
    asm("mov x0, #0x9");
    asm("mov x3, #0x0");
    asm("mov x2, #0x0");
    asm("mov x1, #0x0");
    asm("movk x0, #0x8400, lsl #16");
    asm("smc #0");
}
This was first tested as an alternative way for the sysrq-b reset handler, and that worked like a charm! Now, where to plug such code in kernel early path? Entry point seems to make sense, so I tried this hack on head.S:
--- a/arch/arm64/kernel/head.S
+++ b/arch/arm64/kernel/head.S
@@ -87,6 +87,12 @@
         */
 SYM_CODE_START(primary_entry)
        bl      preserve_boot_args
+       mov x0, #0x9
+       mov x3, #0x0
+       mov x2, #0x0
+       mov x1, #0x0
+       movk x0, #0x8400, lsl #16
+       smc #0
        bl      init_kernel_el    // w0=cpu_boot_mode
        mov     x20, x0
        bl      create_idmap
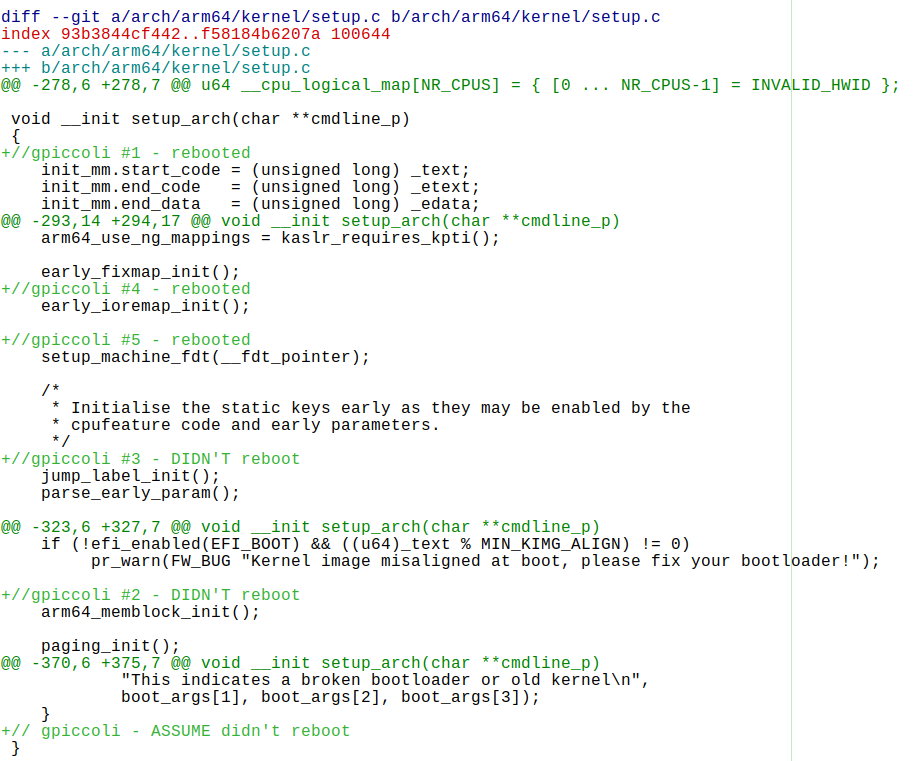
And voilá! With that, the kernel was bootlooping…meaning the board reached kernel code, so the first question was answered and debug could proceed! I decided to take a lucky step and jump directly to start_kernel(), which is C code and way easier to play with no fears of causing another issue while debugging! And the lucky step paid off: kernel was indeed executing that function. So, through a set of attempts using the arm64_smc_reset() above and commenting the results, I got the following “bisect” from the code:
It was a bit ugly to see the diff above in code, hence I’ve added as an image. Basically, it tells us the issue likely happens in setup_machine_fdt(), and by digging more (with more “bisect” reboots), I found the issue happens in fdt_check_header(). Now, as a next step I really wanted to print some values from the guilty function, but using the kernel command-line earlycon didn’t help – it turned out this is not early enough. But what if I could write a very simple really early console, or even an easier approach: copy/port the earlycon code for this board to a bit “earlier” point in the code? And that’s what I tried next: by inspecting (and instrumenting) the msm_serial driver, I came up with this following alternative (a big code snippet here would be just terrible to read, so uploaded the patch instead): https://people.igalia.com/gpiccoli/arm64-really-early-console-msm-qcom.patch Notice the code is quite hacky – it ports the __msm_console_write() function with a pre-configured MMIO address for the serial port to early arch code. But despite the code being merely a “mock-up”, using it with sprintf() (for formatting) allowed me to print stuff, which was quite nice! Unfortunately I didn’t have time to debug the ftrace issue more in this board – I guess the best path forward would be first to submit a proper ifc6640 device-tree, and then follow with the debug. I think it’s likely related to the bootloader version and kernel/DT offsets, so that’s not an easy debug and definitely it’d be time-consuming. But I hope at least the PSCI reset trick, and maybe this really early serial console prototype/idea could be useful to somebody in the world of ARM boards debugging! Thanks for reading and see you in the next blog post (which I expect takes waaay less than 1 year heheh).

Booting upstream kernel on Inforce 6640

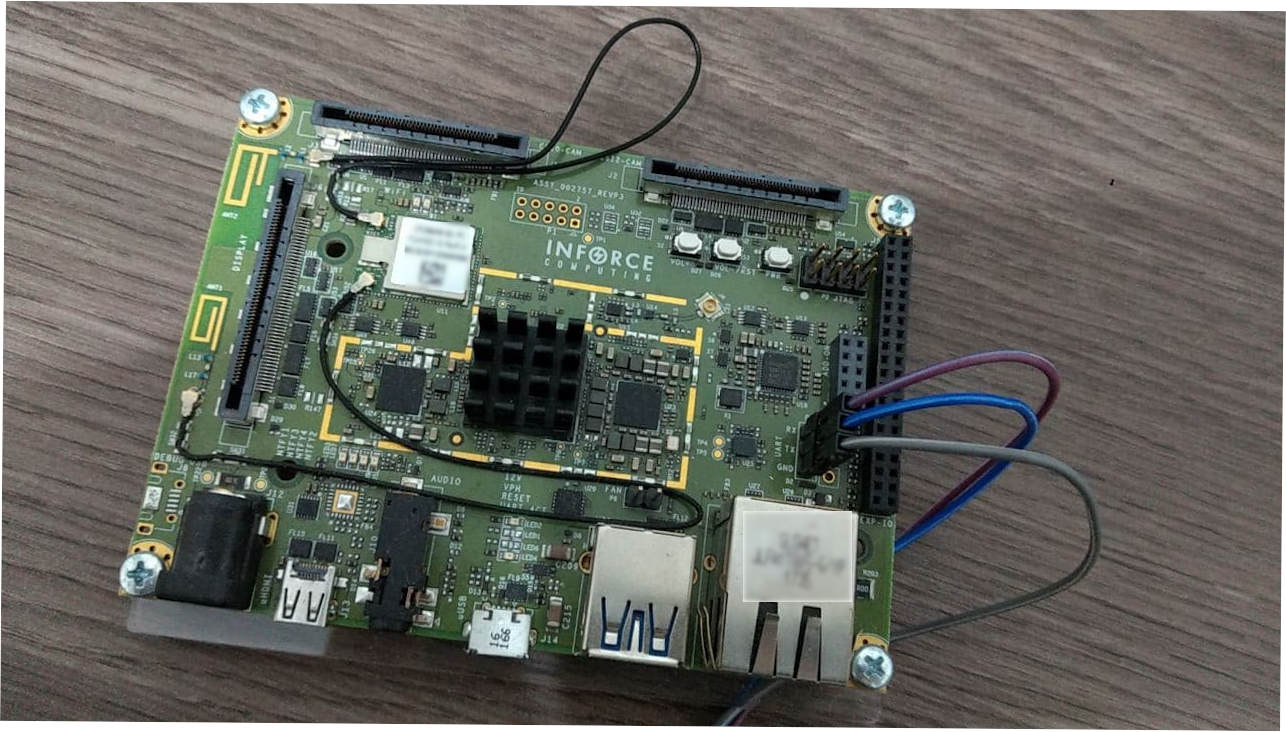
My first task in the Core team at Igalia was to boot a more recent kernel in the Inforce 6640 board , which was very interesting given my very limited experience working in the ARM64 world – also, the work aimed to benefit Igalia’s Graphics team in their Freedreno development. The board itself is pretty powerful and contains a lot of resources; it comes with a quad-core Snapdragon™ 820 processor, Adreno™ 530 GPU, 4G of RAM plus a fast 64G UFS storage. A picture of my unit below: i6640_pic
So, I got a packed Debian image with 4.14 kernel and after some looking, noticed that the kernel was a modified / custom version from Linaro, which they call Qualcomm LT (Landing Tree). Hence, the first idea was to boot this image and see how well it worked. And unsurprisingly, it was working flawlessly – given this was provided by the board vendor, the expectation was that good amount of validation was performed, so we had a starting point here – the working version was the Linaro’s Qualcomm-LT 4.14. In a rush of optimism, I tried to test the latest released mainline kernel at the moment (v5.14) and…it didn’t work! Why would it, right? Where would be the fun? So, next step was to bisect it and I decided to start by using the Linaro’s LT tree – it failed on 5.7+, but succeeded to boot 5.4, although the board seemed pretty slow! First thought was likely a problem in the storage, like a bad device tree config for UFS (the storage device) or a driver change between 4.14 and 5.4. But before looking into that, we needed to understand why kernels 5.4+ weren’t booting…so how to proceed here, if ssh wasn’t working? Yeah…exactly: serial output to the rescue! So I got some jumper cables and decided to use a Raspberry Pi as the other end for serial connection. By connecting all the proper cables and using “minicom”, I could boot a 5.7 kernel and check the progress..and guess what? Kernel was booting normally!!!
But without PCIe – no network / GPU, for example. Also, it was still very slow. And then, an epiphany: it was the device-tree! By dumping the device-tree (from procfs) in both the working 4.14 and the non-working 5.7, a bunch of stuff were missing, like all the PCI structures. But why is that? Somebody just removed stuff from a working device-tree? Nah, it was just an obvious thing I didn’t realize before: up to kernel 5.6, the Inforce 6640 board was relying on the their “cousin’s” device-tree, the Dragonboard 820c! A pretty similar board, so relying on its DT made the board working like a charm, but in kernel 5.6 a proper device-tree for Inforce 6640 was added, although it’s very simple and minimal to boot the board. In order to have a fully working system after that finding, all we needed was to force the usage of the “old” db820c.dts, with the following hack patch:
--- a/arch/arm64/boot/dts/qcom/Makefile
+++ b/arch/arm64/boot/dts/qcom/Makefile
 dtb-$(CONFIG_ARCH_QCOM)        += apq8096-db820c.dtb
-dtb-$(CONFIG_ARCH_QCOM)        += apq8096-ifc6640.dtb
+#dtb-$(CONFIG_ARCH_QCOM)       += apq8096-ifc6640.dtb
 dtb-$(CONFIG_ARCH_QCOM)        += ipq6018-cp01-c1.dtb
OK, so now we have a working upstream kernel (with network!), so let’s investigate the remaining: why the board is so slow? And what about graphics, is it working? I started with the graphics and again, had some issues: board had graphics working on Linaro’s LT tree (v5.13), but not in the upstream 5.13/5.14. Another round of bisects later plus code inspection, and I found the “culprit”: a downstream patch that was also required in order to make the GPU work. The patch added a regulator with “always-on” property and a higher voltage than found in upstream. So, changed that and voilá: we had now a working 5.14 with graphics but…still slow! Moving then to the next journey: why the newer kernels are so much slower? In order to investigate that, I began by comparing the db-820c device-trees among versions, and despite there were differences, nothing rang a bell. So, jumped to sysfs and started investigating there…when it comes to my attention that the CPUs were running slow, very slow – CPUs frequency were tiny . Taking a look in the commits and checking cpufreq drivers, the troublemaker was found: after kernel 4.18, a patch added a driver for handling OPP voltage scaling for Kryo CPUs, which is the case for Snapdragon™ 820. After loading this new module, CPU clocks were back to normal/fast rates, the board was as fast (or even more) than running the original Linaro’s LT 4.14 downstream kernel. But… (yeah, another but)…after some simple CPU benchmarks, just some seconds after the beginning of the tests, board rebooted into a firmware error state. It was like as if it couldn’t handle all the CPU speed in the newer kernels. Here, I used the very powerful ftrace tooling to determine the reason of this behavior. And guess what was found? Cooling! The responsible for that was kernel lack of throttling. The following trace snippet shows how the governor would reduce the CPU clock/voltage in order to preserve CPUs health:
 => cpufreq_governor_limits.part.6
 => cpufreq_set_policy
 => cpufreq_update_policy
 => cpufreq_set_cur_state
 => thermal_cdev_update
 => step_wise_throttle
 => handle_thermal_trip
 => thermal_zone_device_update.part.10
 => thermal_zone_device_check
 => process_one_work
 => worker_thread
The key here is the function step_wise_throttle which downscale the CPU frequency to prevent from overheating. In order to have it properly working, cooling maps/trip points are required in the device-tree, it’s present in some downstream patches on Linaro’s kernel – but when that work was upstream’ed, it lacked some portions, hence if we have cpufreq driver and high frequencies, we’re prone to overheating / firmware reboots. The patch that fixes that was re-submitted by another person and I tried to get that accepted, by “lobbying” in the mailing-list and showing our test results, but up to 5.16-rc6 it isn’t present in Linus tree. Finally, worth to mention 2 things: for some reason, building a kernel with ftrace after v5.7 prevents it from booting. This led to a very interesting debug, like debug-by-rebooting (using a firmware triggered reboot in assembly), (re-)implementing a very early console to show output much before “earlycon” is available – stay tuned for a blog post about that! Second, we still lack that “regulator-always-on” necessary to have a functional GPU – after submitting a patch for that, I’ve discussed that with the maintainer, and it seems we should have the user of such regulator to request it properly – due to other tasks I couldn’t continue this work. So, in summary, if you want to boot an upstream kernel (5.14+) on Inforce 6640, the steps are:
  • Disable the ifc6640.dts, and rely on db820c DT;
  • Boot without ftrace and with the Kryo cpufreq driver built-in (ARM_QCOM_CPUFREQ_NVMEM=y);
  • Apply the “regulator-always-on” quirk patch;
  • Also apply the cooling-maps patch;
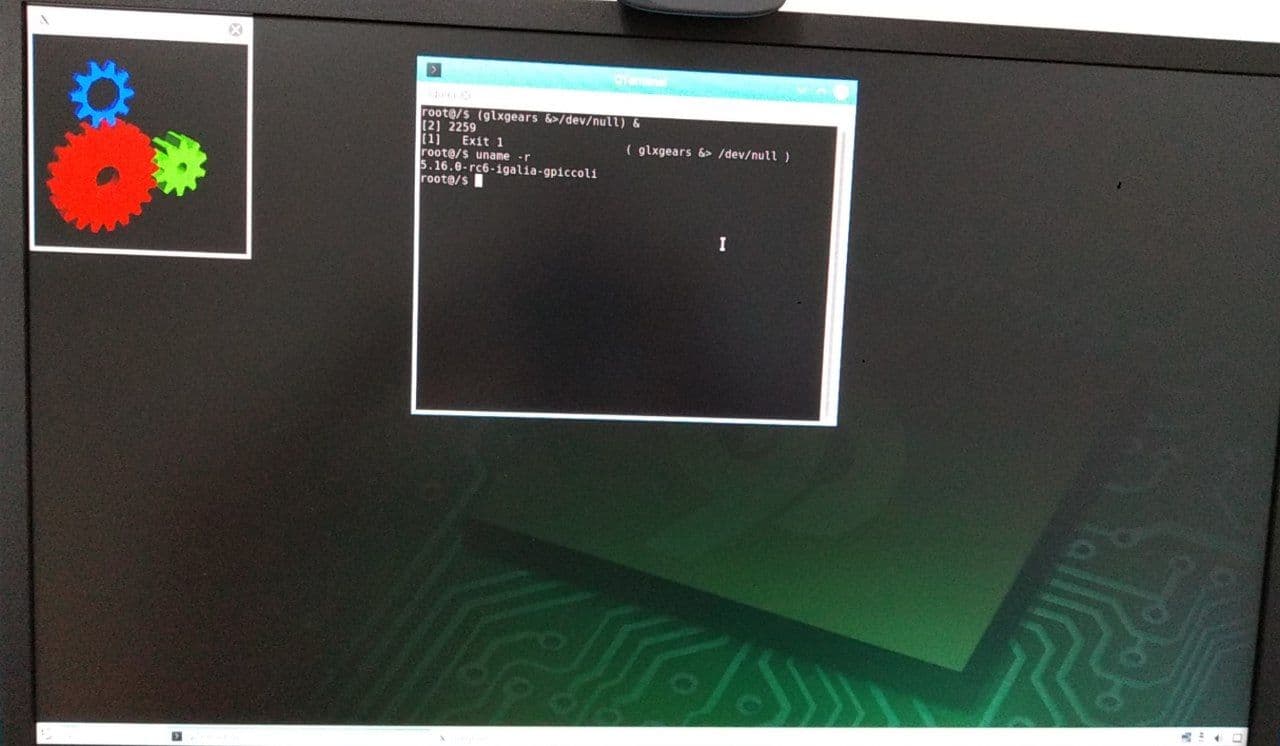
With that, one should be able to boot a recent kernel in this great board, and even with graphics! Take a look in the Inforce 6640 running glxgears in a recent kernel: i6640_glxgears Hope the read was enjoyable and useful, feel free to leave your comment or ping on IRC (gpiccoli @OFTC/Libera) =]