Hadoop has become a sort of standard for processing large amounts of information (BigData). Once a niche product, the adoption of Hadoop among large corporations, like Facebook or Twitter, and small startups has increased dramatically in the recent years. Hadoop, an open-source implementation of Google’s MapReduce + GFS, provides a high-level API that makes distributed programming easier.
In the MapReduce paradigm, a dataset problem is divided into a small chunk of data. Every split is processed by a node, transforming a given input into an output (Map). Later, the results of several nodes are put together again and processed (Reduce). MapReduce is a zero-shared architecture, that means that each node cannot depend on the the results of another node. Surprisingly, many problems can be resolved using this approach, from creating a page-index, to analyzing the interconnections within a network, etc. For the multiple applications of MapReduce I recommend the book “Data-Intensive Processing with MapReduce”.
Together with Hadoop, there’s a whole stack of other tools built on top of it. Such tools are for example HBase, a key-value datastore built upon HDFS (Hadoop FileSystem); Hive, a sort of SQL for coding MapReduce jobs, initially developed by Facebook; Pig, another MapReduce high-level dialect or Mahout, a framework for machine learning and data mining. It’s really a big ecosystem. Some people compare the term Hadoop to Linux, in the sense that although it’s a small part of a bigger thing it has become to mean the whole thing. If you want to know more about the Hadoop ecosystem I recommend you the talk “Apache Hadoop – Petabytes and Terawatts” by Jakob Homan.
If you have ever taken a look at Hadoop, you have probably coded the famous WordCount example, the HelloWorld! of Hadoop. The WordCount example, reads several files, tokenize them into words, and counts the total number of words. As with the classic HelloWorld! example, it’s helpful for understanding the basics but pretty much useless. We wanted to go beyond that and build something useful, a real-world example that could help people understand the potential of Hadoop. With that goal in mind, we decided to implement an email analysis tool.
Metamail, is an email analysis tool that relies on Hadoop for doing data analysis and processing. The application is divided into three modules:
- Email Analyzer. A collection of MapReduce jobs for computing statistics. For example, number of emails sent by year, by month, by day of the week, etc; size of emails; top 50 thread lengths, etc
- Database importer. Before running the MapReduce jobs, it’s necessary to import emails into a HBase database. Later those emails are retrieved and processed by the MapReduce jobs.
- Web UI. Results from the MapReduce jobs are meaningless if there’s no way to manipulate, understand or visualize those results. The UI shows different charts for each type of statistic crunched.
You can check an online version of the Web UI at http://igalia-metamail.herokuapp.com. As sample data, I have used the Email Enron Dataset, which is a small dataset (0.5GB) freed during the Enron trial. In any case, the analysis jobs are valid for any email dataset, so it’s possible to use Metamail for analysing your personal email or the email from your organization. You can check the code of the project and instructions about how to deploy it at the Github repository.
Working on this project has been very interesting. It has help me to understand several things about Hadoop and data analysis:
- Hadoop is pretty much useless on its own. Hadoop provides a wonderful architecture for distributed computing. Compared to other distributed computing architectures like PVM and MPI, it’s definitely much easier to use. However, data analysis, machine learning, natural-language processing, graph processing, etc are the other part of the equation that makes the magic of BigData happen. One thing without the other is useless.
- Hadoop excels at processing large amounts of data. Initially, I did everything with Hadoop parting from this article by Cloudera: “Hadoop for Archiving Email”. Hadoop expects that the minimum chunk of data to be 64MB. When the data processed is much smaller than this size, as it happens with almost all emails, a previous step consists in attaching data together into a single chunk. Processing the data with Hadoop also required to implement a custom RecordReader for extracting emails from a split. Finally, I decided to store everything in HBase, and let HBase feed the data to Hadoop. This approach is good when you want to process pieces of data that are smaller than a HDFS data-block.
- Visualization is essential to understand data. Measuring is the first step to understand a system, but if you cannot easily visualize the results of your measuring it’s difficult to understand and interpret data. In Metamail, I have used D3 for visualizing the results. D3 is a javascript library for graphic plotting which is becoming more and more popular. Initially, I also post-processed the results with R, the popular statistic programming language, for generating the charts. Both tools are commonly used together with Hadoop.
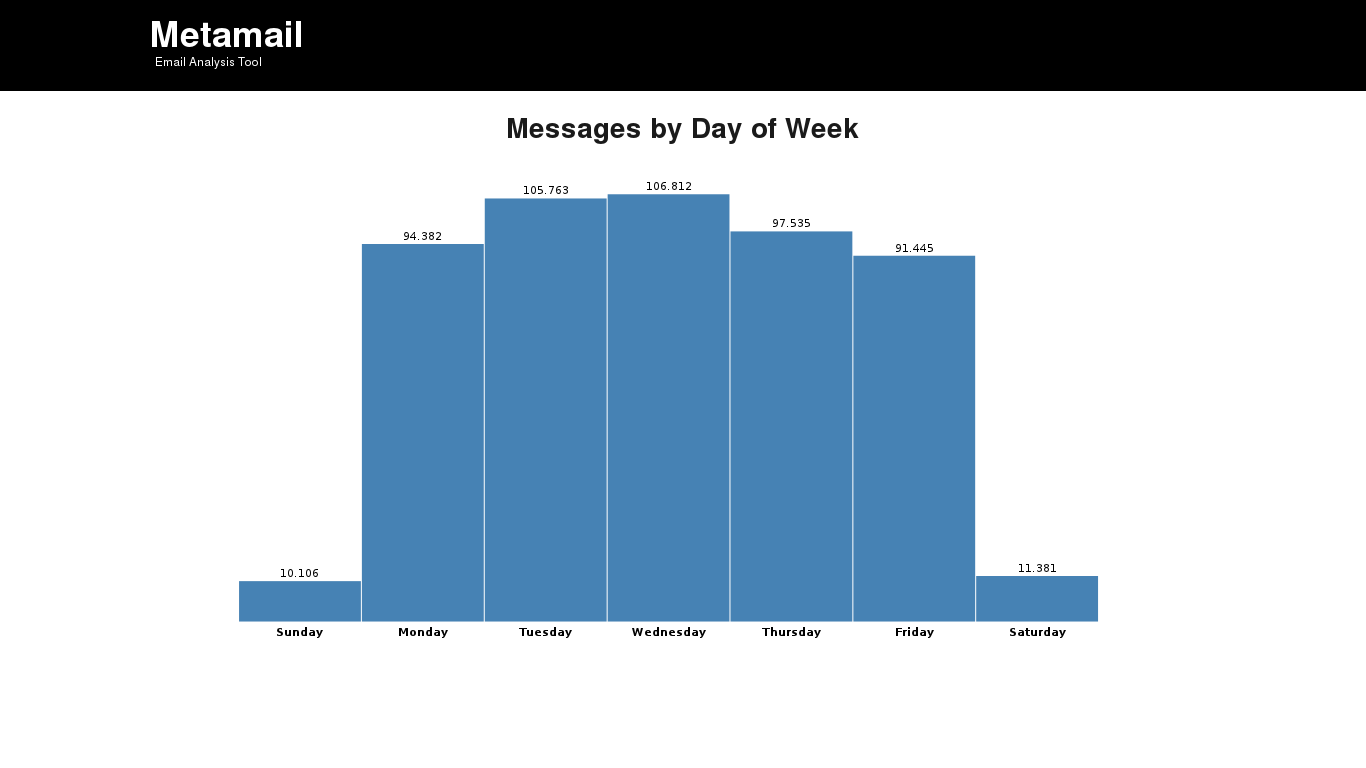
- People tend to work less on Mondays and Fridays
 I knew that, but now the data confirms it. There’s less email sent on Monday and Friday than the rest of the working days. I observed also this pattern analysing some of our email at Igalia. In compensation, there’s also people who send emails on Saturday and Sunday (those workaholics :))
Please drop me a line if you have any feedback. Thanks!