Measuring paint performance is a balancing act: you need precision, but the measurement itself can’t slow things down.
In my previous post, I introduced Container Timing, a new web API allowing developers to measure the rendering performance of DOM subtrees. Today, I will dive into the technical details of how I implemented this in Blink, the rendering engine used by Chromium.
The Architecture: Hooking into Paint #
In Blink, the rendering pipeline goes through several stages: Style, Layout, Paint, and Composite. The Container Timing implementation relies heavily on the Paint stage.
The main idea was not reinventing the wheel. Blink already provides paint timing detection for the implementation of Large Contentful Paint (LCP) and Element Timing. However, this is targeted for specific nodes (an image, a text block). In Container Timing we care about subtrees.
So, when a paint is detected, we need to quickly decide whether the paint is relevant to Container Timing.
Is a paint interesting for Container Timing? #
As the DOM tree is built (on parsing, or because of a script), we check the value of the attribute containertiming for each Element. When found, we flag that element and all its descendants with the flag SelfOrAncestorHasContainerTiming.
We also have the attribute containertiming-ignore. When found, we will stop the propagation.
So, later, for any paint, we will immediately know if the paint should be tracked for Container Timing or not. This minimizes the impact when the element is not tracked.
What about DOM tree updates after parsing?
This is a pain point for performance. When a DOM element starts/stops having the containertiming or containertiming-ignore attribute after the DOM tree is created, we need to traverse the tree to update the flag.
Collecting Paint Updates #
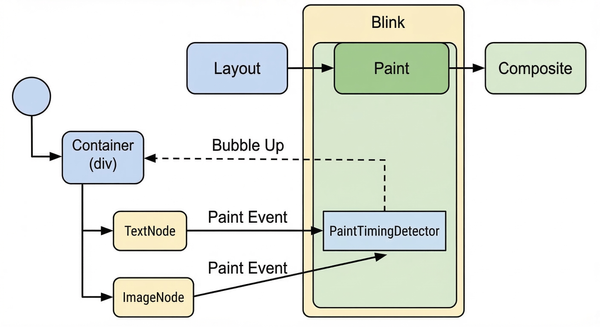
When a paint is detected, we just reuse the existing implementation in the ImagePaintTimingDetector and TextPaintTimingDetector, that are also used for LCP and Element Timing for the relevant elements.
Note
Only text and image paints are currently tracked. Video, canvas, and SVG are not yet supported.
We first determine if the paint should be recorded for Container Timing. And this is fast because of the SelfOrAncestorHasContainerTiming flag.
The timing detectors give us the area of the visual rectangle, the bounding box on screen that was painted.
For Container Timing, we added a mechanism to walk up the DOM tree from the painted node. If we encounter an ancestor that is marked with the containertiming attribute (a container timing root), we report that paint event to it.
This “bubbling up” of paint events is illustrated in the diagram below.
Is this expensive?
It depends on the depth of the hierarchy from the node to the most remote ancestor. Further work will be needed to speed up or avoid these traversals.
Aggregating Regions #
One of the most interesting challenges was determining the size of the container. It is not just the size of the container timing root. It is the union of all painted content.
Two reasons for this:
- Being able to incrementally determine the updated area, in a way that is inspired by Largest Contentful Paint.
- To reduce the amount of performance events generated, we discard the paints that do not increase the area.
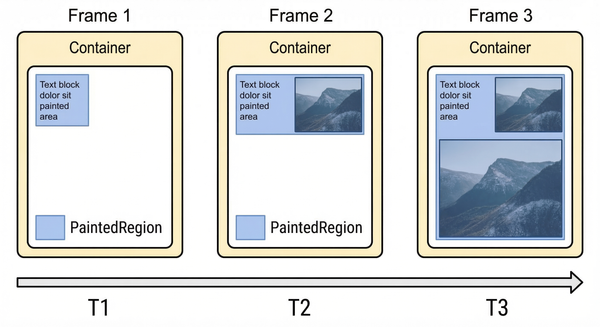
We maintain a PaintedRegion for each container. This is a non-overlapping union of the rectangles that cover the updated area:
- Initial Paint: When the first child paints, we initialize the region with its visual rectangle.
- Subsequent Paints: As more images load or text renders, we perform a union operation:
CurrentRegion = Union(CurrentRegion, NewPaintRect).
So, as paints are detected, each container will aggregate the parts of the screen that have been painted by all their children.
We use cc::Region, based on SkRegion from the Skia graphics library to handle these unions efficiently.
The following diagram shows this process in action over three frames.
Buffering and Reporting #
Because a container paints over multiple frames (e.g., text renders first, then a background image, then a lazy-loaded icon), we cannot just emit one entry. We generate candidates.
For each container, when a paint that increases the painted region is detected, we schedule a new event. Right at the end of the frame presentation, we package the current state into a new performance timeline entry: a PerformanceContainerTiming object.
This object contains:
startTime: The presentation time of the paint. In the Chromium implementation, this is set to the moment the frame was presented to the user, and matchespresentationTimefromPaintTimingMixin.firstRenderTime: the time of the first paint we detected in the container. Useful for getting a hint of how long a component has been showing updates to the user.- The container element, in two ways. The
identifieris the value of thecontainertimingattribute.rootElementis the actual element. size: The total area of the aggregatedPaintedRegion.lastPaintedElement: the last element that triggered a paint — handy for debugging which child caused the latest candidate.
Note
We support the PaintTimingMixin, which adds paintTime (when the paint was committed to the compositor) and presentationTime (when the frame was presented to the user). In Chromium, startTime is set to presentationTime.
This design means the observer might receive multiple entries for the same container. This is intentional: it lets developers pick the milestone that matters to them, typically the point where size stops growing.
Handling “Ignore” #
We also implemented the containertiming-ignore attribute. When a node has this attribute, it stops the SelfOrAncestorHasContainerTiming flag from propagating further down its subtree, so paints within it are not walked up to the container timing root, and never contribute to that container PaintedRegion.
Ignoring is useful for a number of things:
- Debug overlays and instrumentation widgets, which should not inflate the measured painted area.
- Visually independent nested components: child dialogs or overlays that paint independently from the container and would affect the size metric if included.
Tip
containertiming-ignore on large untracked subtrees also reduces traversal depth, helping with the cost mentioned above.
How to test #
With flag propagation, region aggregation, candidate buffering, and selective ignoring all in place, the implementation is complete.
Container Timing is ready for test in Chromium. Just use the Blink feature flag ContainerTiming:
chrome --enable-blink-features=ContainerTimingWhat’s next? #
- We are preparing an Origin Trial in Chromium, a new step towards enabling Container Timing by default. Stay tuned!
- Optimizations in the traversal. We have some ideas for avoiding the traversal of the full tree when a paint is detected, to find the container timing root.
- Support for detecting paints in other parts of the tree. Shadow DOM is specially interesting here due to its importance in web components.
Wrapping up #
Building this native implementation was a great exercise in reusing Blink’s existing performance infrastructure while extending it to support subtree-level aggregation.
The key insight: subtree-level metrics didn’t require a new paint tracking system. Only a way to aggregate and bubble up what Blink was already measuring.
The result is a native, low-overhead API for measuring the rendering performance of entire components.
Thanks! #
This has been done as part of the collaboration between Bloomberg and Igalia. Thanks!
![]()
![]()
References #
- Implementation of SelfOrAncestorHasContainerTiming: 1, 2.
- ContainerTiming aggregation at container_timing.cc.
- Paint detection in text and image paint timing detectors.
- Specification draft @ WICG.
- Related specifications: Element Timing, Largest Contentful Paint, Paint Timing Mixin.
- Explainer.
- Shadow DOM Handling discussion.
- Optimizing hierarchy traversals.
- Life of a Pixel presentation about the Blink rendering pipeline by Steve Kobes.