Over the last year, as part of the collaboration between Igalia and Bloomberg to improve web performance observability, I worked on a new web performance API: Container Timing. This standard aims to make component-level performance measurement as easy as page-level metrics like LCP and FCP.
My focus has been writing the native implementation in Chromium, which is now available behind a feature flag.
In this post, I will explain why this API is needed, how it works, and how you can experiment with it today. In a follow-up post, I will dive deep into the implementation details within the Blink rendering engine.
The problem: measuring component performance #
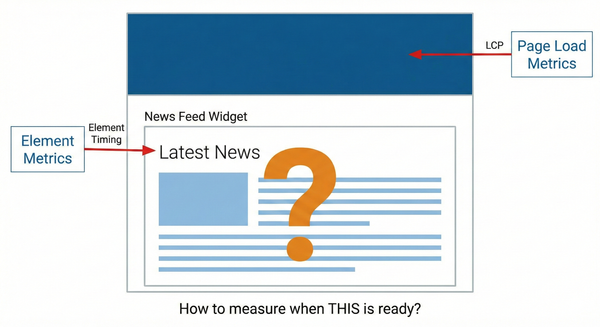
We currently use Largest Contentful Paint (LCP) and First Contentful Paint (FCP) to measure web page loading performance. Both metrics are page-scoped, meaning they evaluate the user perceived load speed for full page.
The Element Timing API shifts the focus to individual DOM elements. By targetting specific elements, like hero images or a headers, we can measure their specific rendering performance independent of the rest of the page.
However, modern web development is component-based. Developers build complex widgets (as grids, charts, feeds or panels) that are made of many elements. It is not trivial to understand the performance of those components:
- LCP may not be useful as another large image painting could delay it.
- Measuring a web component with Element Timing may require instrumenting all the significant elements one by one.
The solution: Container Timing #
This is where Container Timing comes in! With the new specification, a web developer can mark subtrees of the DOM as “containers”. Then, it provides performance entries aggregating the painting time of that subtree.
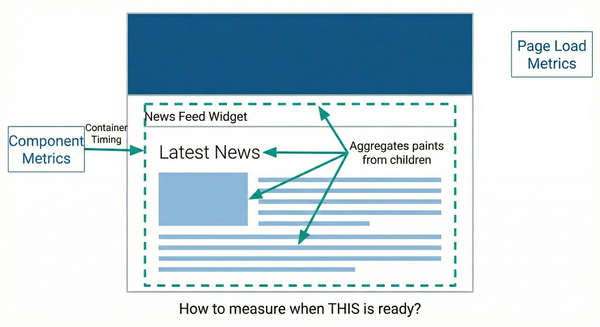
This way, we can answer: “when did a specific component finish painting its content?”.
Some examples:
- Breaking down the contributors to the initial page load: with Container Timing we can focus on the components that are more relevant to the user experience.
- Single page application navigation: when a soft navigation shows a new component on the screen, we can obtain painting information for it.
- Lazy-loaded components: Tracking when a widget that loads below the fold is fully visible.
- Third-party content: Monitoring the performance of ads or embedded widgets.
You just need to add, to the top element of the subtree, the new attribute containertiming. When you add it to an HTML element, the browser will track all the painting updates of that element and its descendants.
What happens under the hood? The browser will start monitoring the rendering pipeline for paints that contribute to representing the subtree. When a new frame is painted, if that paints new areas for that subtree, it reports a performance entry showing the increase in painted area. It is similar to LCP, but for a specific subtree!
How to use Container Timing? #
Using the API is straightforward. First, mark the containers you want to track in HTML:
<div id="my-widget" containertiming="widget-load">
  <img src="graph.png" />
  <p>Loading data...</p>
</div>
Then, use a PerformanceObserver to listen for container entries:
const observer = new PerformanceObserver((list) => {
  list.getEntries().forEach((entry) => {
    console.log(`Container '${entry.identifier}' painted.`);
    console.log(`Time: ${entry.startTime}`);
    console.log(`Size: ${entry.size}`); // The area painted
  });
});

observer.observe({ type: "container", buffered: true });
When the web contents load, new Performance entries will be emitted with the container updates.
Which entry will be interesting? The API lets you choose what best fits your needs! Some ideas:
- The most important entry could be the last one: the one that increased the painted area for the last time. Something similar to LCP.
- Or maybe the last one that contributed a significant size increase?
- Or the last one before a user interaction?
A native implementation for Chromium #
In the initial steps of the specification, Jason Williams wrote a polyfill that worked on top of Element Timing. This was very useful to understand and polish the kind of information the specification could provide. However, this had its own performance impact.
Deprecation Notice:
The polyfill is now deprecated and no longer maintained, as the native API cannot be fully replicated using Element Timing. Please use the native implementation for accurate results.
So I started a native implementation in Chromium. The main idea was working on top of the already existing implementation for Element Timing, and add the remaining bits.
In my next blog post I will go through the implementation details. But, for this post, it is relevant to state that the goals of this native implementation were:
- Minimizing the overhead. It should be almost zero when elements are not interesting to Container Timing, and very fast and light when paints were relevant.
- It should reuse as much as possible of the already existing logic for Element Timing.
The native implementation has landed and is available in Chromium144+, but still behind the ContainerTiming feature flag.
You can experiment with this feature locally by passing the following flag to Chromium at startup:
chrome --enable-blink-features=ContainerTimingOr you can just enable the “Experimental Web Platform features” in chrome://flags.
Upcoming trials #
So now, it is time to collect feedback from the actual web developers.
We have already presented the specification in several conferences (as BlinkOn 20 or Performance.now() 2024). And discussions are ongoing in the Web Performance Working Group.
We just announced the Dev Trial in the blink-dev mailing list! The feature is now officially ready for testing.
What’s next? We are also preparing an Origin Trial, that will allow developers to test the specification in production for a subset of their users.
If you want to provide feedback, we are collecting it in the explainer ticket tracker.
Wrapping up #
With Container Timing, you will be able to measure paintings at the web component level, filling a significant gap in the web performance monitoring landscape.
If you struggled with finding out the ready time of your widgets, just try it! It is available, under the feature flags ContainerTiming, in Chromium Stable today.
And stay tuned! In a follow up post, I will go through the native implementation details in Chromium.
Thanks! #
This has been done as part of the collaboration between Bloomberg and Igalia. Thanks!
![]()
![]()