As part of my performance analysis work for LGE webOS, I often had to capture Chrome Traces from an embedded device. So, to make it convenient, I wrote a simple command line helper to obtain the traces remotely, named trace-chrome.
In this blog post will explain why it is useful, and how to use it.
TL;DR #
If you want to read directly about the tool, jump to the how to use section.
Tracing Chromium remotely #
Chromium provides an infrastructure for capturing static tracing data, based on Perfetto. In this blog post I am not going through its architecture or implementation, but focus on how we instruct a trace capture to start and stop, and how to then fetch the results.
Chrome/Chromium provides user interfaces for capturing and analyzing traces locally. This can be done opening a tab and pointing it to the chrome://tracing URL.
The tracing capture UI is quite powerful, and completely implemented in web. This has a downside, though: running the capture UI introduces a significant overhead in several resources (CPU, memory, GPU, …).
This overhead may be even more significant when tracing Chromium or any other Chromium based web runtime in an embedded device, where we have CPU, storage and memory constraints.
Chromium does a great work at minimizing the overhead, by postponing the trace processing as much as possible, and providing a minimal UI when the capture is ongoing. But it may still be too much.
How to avoid this problem?
- Capturing UI should not run in the system we are tracing. We can run the UI in a different computer to capture the trace.
- Same about storage, we want it to happen in a different computer.
The solution for both is tracing remotely. Both the user interface for controlling the recording, and the recording storage happen in a different computer.
Setting up remote tracing support #
First, some nomenclature I will use:
- Target device: it is the one that runs the Chromium web runtime instance we are going to trace.
- Host device: the device that will run the tracing UI, to configure, start and stop the recording, and to explore the tracing results.
OK, now we know we want to trace remotely the target device Chromium instance. How can we do that? First, we need to connect our tracing tools running in the host to the Chromium instance in the target device.
This is done using the remote debugging port: a multi-purpose HTTP port provided by Chromium. This port is used not only for tracing, it offers access to Chrome Developer Tools.
The Chromium remote debugging port is disabled by default, but it can be enabled using the command line switch --remote-debugging-port=PORT in the target Chromium instance. This will open an HTTP port in the localhost interface, that can be used to connect.
Why localhost? Because this interface does not provide any authentication or encryption. So it is unsafe. It is user responsibility to provide some security (i.e. by using an setting an SSH tunnel between the host and the target device to connect to the remote debugging port).
Capturing traces with chrome://inspect #
Chromium browser provides a solution for tracing remotely. Just opening the URL chrome://inspect in the host device. It provides this user interface:
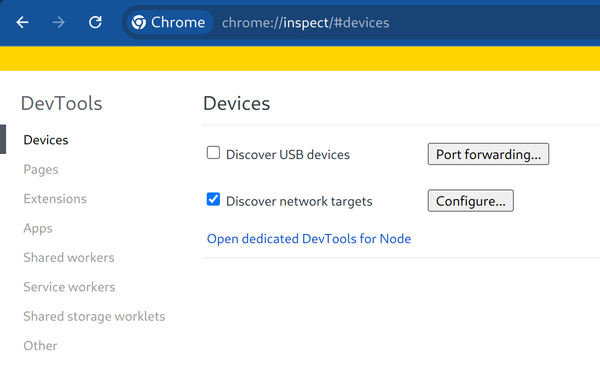
First, the checkbox for Discover network targets needs to be set.
Then press the Configure… button to set the list of IP addressed and ports where we expect target remote debugging ports to be.
Do not forget to add to the list the end point that is accessible from the host device. I.e. in the case of an SSH tunnel from the host device to the target device port, it needs to be the host side of the tunnel.
For the case we set up the host side tunnel at the port 10101, we will see this:
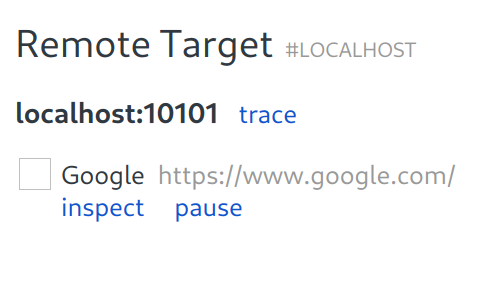
Then, just pressing the trace link will show the Chromium tracing UI, but connected to the target device Chromium instance.
Capturing traces with trace-chrome #
Over the last 8 years, I have been involved quite often in exploring the performance of Chromium in embedded devices. Specifically for the LGE webOS web stack. In this problem space, Chromium tracing capabilities are handy, providing a developers oriented view of different metrics, including the time spent running known operations in specific threads.
At that time I did not know about chrome://inspect so I really did not have an easy way to collect Chromium traces from a different machine. This is important as one performance analysis principle is that collecting the information should be as lightweight as possible. Running the tracing UI in the same Chromium instance that is analyzed is against that principle.
The solution? I wrote a very simple NodeJS script, that allows to capture a Chromium trace from the command line.
This is convenient for several reasons:
- No need to launch the full tracing UI.
- As we completely detach that UI from the capturing step, without an additional step to record the trace to a file, we are not affected on the unstability of the tracing UI handling the captured trace (not a problem usually, but it happens).
- Easier to repeat tests for specific tracing categories, instead of manually enabling them in the tracing UI.
The script just provides an easy to use command line interface to the already existing chrome-remote-interface NodeJS module.
The project is open source, and available at github.com/jdapena/trace-chrome.
How to use trace-chrome #
Now, the instructions to use trace-chrome. The tool depends on having a working NodeJS environment in the host.
Installation #
First, clone the Github repository in the host:
git clone github.com:jdapena/trace-chromeThen, install the dependencies. To do this, you need to have a working NodeJS environment.
cd trace-chrome
npm install
Running #
Now it is possible to try the tool. To get the command line help just run:
$ bin/trace-chrome --help
Usage: trace-chrome [options]

Options:
  -H, --host <host>                        Remote debugging protocol host (default: "localhost")
  -p, --port <port>                        Remote debugging protocool port (default: "9876")
  -s, --showcategories                     Show categories
  -O, --output <path>                      Output file (default: "")
  -c, --categories <categories>            Set categories (default: "")
  -e, --excludecategories <categories>     Exclude categories (default: "")
  --systrace                               Enable systrace
  --memory_dump_mode <mode>                Memory dump mode (default: "")
  --memory_dump_interval <interval_in_ms>  Memory dump interval in ms (default: 2000)
  --dump_memory_at_stop
  -h, --help                               display help for command
To connect to a running Chromium instance remote debugging port, the --host and --port parameters need to be used. In the examples I am going to use the port 9999 and the host localhost.
Warning
Note that, in this case, the parameter --host refers to the network address of the remote debugging port access point. It is not referring to the host machine where we run the script.
Getting the tracing categories #
First, to check which tracing categories are available, we can use the option --showcategories:
bin/trace-chrome --host localhost --port 9999 --showcategoriesWe will obtain a list like this:
AccountFetcherService
Blob
CacheStorage
Calculators
CameraStream
...
Recording a session #
Now, the most important step: recording a Chromium trace. To do this, we will provide a list of categories (parameter --categories), and a file path to record the trace (parameter --output):
bin/trace-chrome --host localhost --port 9999 \
  --categories "blink,cc,gpu,renderer.scheduler,sequence_manager,v8,toplevel,viz" \
  --output js_and_rendering.json
This will start recording. To stop recording, just press <Ctrl>+C, and the trace will be transferred and stored to the provided file path.
Tip
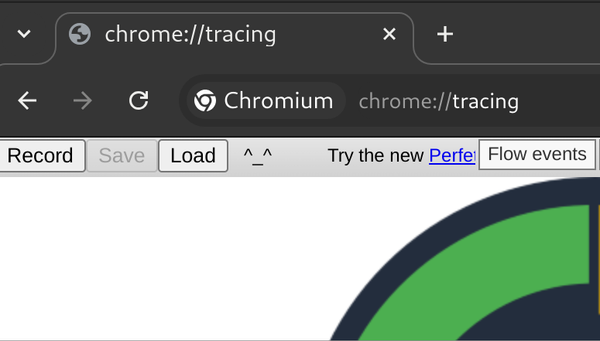
Which categories to use? Good presets for certain problem scopes can be obtained in Chrome. Just open chrome://tracing, press the Record button, and play with the predefined settings. In the bottom you will see the list of categories to pass for each of them.
Opening the trace file #
Now the tracing file has been obtained, it can be opened from Chrome or Chromium running in host: load in a tab the URL chrome://tracing and press the Load button.
Tip
The traces are completely standalone. So they can be loaded in any other computer without any additional artifact. This is useful, as those traces can be shared among developers or uploaded to a ticket tracker.
But, if you want to do that, do not forget to compress first with gzip to make the trace smaller. chrome://tracing can open the compressed traces directly.
Capturing memory infra dumps #
The script also supports periodical recording of the memory-infra system. This captures periodical dumps of the state of memory, with specific instrumentation in several categories.
To use it, add the category disabled-by-default-memory-infra, and pass the following parameters to configure the capture:
--memory_dump_mode <background|detailed|simple>: level of detail.backgroundis designed to have almost no impact in execution, running very fast.lightmode shows a few entries, whiledetailedis unlimited, and provides the most complete information.--memory_dump_interval: the interval in miliseconds between snapshots.
Using npx #
For convenience, it is also possible to use trace-chrome with npx. It will install the script and the dependencies in the NPM cache, and run from them:
npx jdapena/trace-chrome --helpExamples #
- Record a trace of the categories for the Web Developer mode in Chrome Tracing UI:
bin/trace-chrome --host HOST --port PORT \
 --categories "blink,cc,netlog,renderer.scheduler,sequence_manager,toplevel,v8" \
--output web_developer.json- Record memory infrastructure snapshots every 10 seconds:
bin/trace-chrome --host HOST --port PORT \
 --categories "disabled-by-default-memory-infra" --memory_dump_mode detailed \
 --memory_dump_interval 10000 --output memory_infra.json
Wrapping up #
trace-chrome is a very simple tool, just providing a convenient command line interface for interacting with remote Chromium instances. It is specially useful for tracing embedded devices.
It has been useful for me for years, in a number of platforms, from Windows to Linux, from desktop to low end devices.
Try it!