In both web and NodeJS worlds, the main runtime for executing program logic is the Javascript runtime. Because of that, a huge number of applications and user interfaces are using it. As any software component, Javascript code uses resources of the system, that are not unlimited. We should be careful when using CPU time, application storage, or memory.
In this blog post we are going to focus on the latter.
Where’s my memory! #
Usually the objects allocated by a web page are not a lot, so they do not eat a huge amount of memory for a modern and beefy computer. But we find problems like:
- Oh, but I don’t have a single web page loaded. I like those 40-80 tabs all open for some reason… Well, no, there’s no reason for that! But that’s another topic.
- Many users are not using beefy phones or computers. So using memory has an impact on what they can do.
The user may not be happy with the web application developer implementation choices. And this developer may want to be… more efficient. Do something.
Where’s my memory! The cloud strikes back #
Now… Think about the cloud providers. And developers implementing software using NodeJS in the cloud. The contract with the provider may limit the available memory… Or get money depending on the actual usage.
So… An innocent script that takes 10MB, but is run thousands or millions or times for a few seconds. That is expensive!
These developers will need to make their apps… again, more efficient.
A new hope #
In performance problems, we usually want to have reliable data of what is happening, and when. Memory problems are no different. We need some observability of the memory usage.
Chromium and NodeJS share their Javascript runtime, V8, and it provides some tools to help with memory investigation.
In this post we are going to focus on the family of tools around a V8 feature named heap snapshot, that allows capturing the memory usage at any time in a Javascript execution context.
About the heap #
:!: This is a fast recap on how Javascript heap works, you can skip it if you want
In V8 Javascript runtime, variables, no matter their scope, are allocated on a heap. No matter if it is a number, a string, an object or a function, all of them are stored there. Not only that, in V8 even the code is stored in the heap.
But, in Javascript, memory is freed lazily, with a garbage collection. This means that, when an object is not used anymore, its memory is not immediately disposed. Garbage collector will explore which objects are disposable later, and free them when it is convenient.
How do we know if an object is still used? The idea is simple: objects are used if they can be accessed. To find out which ones, the runtime will take the root objects, and explore recursively all the object references. Any object that has not been found in that exploration can be discarded.
OK, and what is a root object? In a script it can be the objects in the global context. But also Javascript objects referred from native objects.
More details of how the V8 garbage collector works are out of the scope of this post. If you want to learn more, this post should provide a good overview of current implementation: Trash talk: the Orinoco garbage collector.
Heap snapshot: how does it work? #
OK, so we know all the Javascript memory allocation goes through the heap. And, as I said, heap snapshot is a tool to investigate memory problems.
The name is quite explicit about how it works. Heap snapshot will stop the Javascript execution, traverse all the heap, analyze it, and dump it in a meaningful format that can be investigated.
What kind of information does it have?
- Which objects are in the heap, and their types.
- How much memory each object takes.
- The references between them, so we can understand which object is keeping another one from being disposed.
- In some of the tools, it can also store the stack trace of the code that allocated that memory.
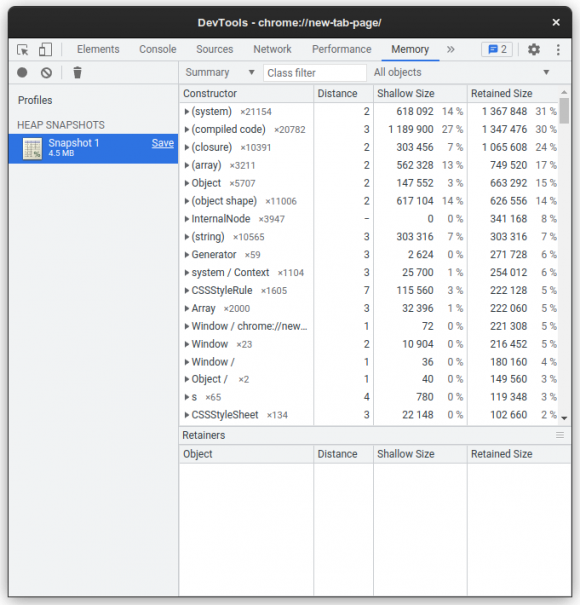
The format of those snapshots is using JSON, and it can be opened from Chromium developer tools for analysis.
Heap snapshots from Chromium #
In the Chromium browser, heap snapshots can be obtained from the Chrome developer tools, accessed through the Inspect right button menu option.
This is common to any browser based in Chromium exposing those developer tools locally or remotely.
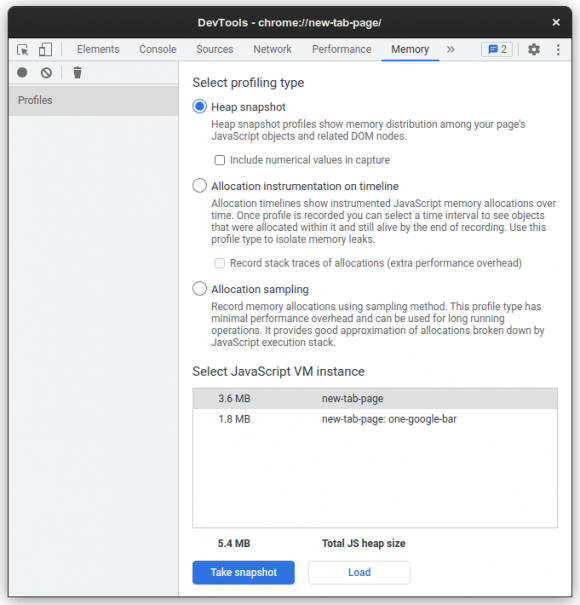
Once the developer tools are visible, there is the Memory tab:
We can select three profiling types:
- Heap snapshot: it just captures the heap at the specific moment it is captured.
- Allocation instrumentation on timeline: this records all the allocations over time, in a session, allowing to check the allocation that happened in a specific time range. This is quite expensive, and suitable only for short profiling sessions.
- Allocation sampling: instead of capturing all allocations, this one records them with sampling. Not as accurate as allocation instrumentation, but very lightweight, allowing to give a good approximation for a long profiling session.
In all cases, we will get a profiling report that we can analyze later.
Heap snapshots from NodeJS #
Using Chromium dev tools UI #
In NodeJS, we can attach the Chrome dev tools passing --inspect through the command line or the NODE_OPTIONS environment variable. This will attach the inspector to NodeJS, but it does not stop execution. The variant --inspect-brk will break on debugger at start of the user script.
How does it work? It will open a port in localhost:9229, and then this can be accessed from Chromium browser URL chrome://inspect. The UI allows users to select which hosts to listen to for Node sessions. The end point can be modified using --inspect=[HOST:]PORT, --inspect-brk=[HOST:]PORT or with the specific command line argument --inspect-port=[HOST:]PORT.
Once you attach dev tools inspector, you can access the Memory tab as in the case of Chromium
There is a problem, though, when we are using NODE_OPTIONS. All instances of NodeJS will take the same parameter, so they will try to attach to the same host and port. And only the first instance will get the port. So it is less useful than we would expect for a session running multiple NodeJS processes (as it can be just running NPM or YARN to run stuff).
Oh, but there are some tricks!:
- If you pass port
0it will allocate a port (and report it through the console!). So you can inspect any arbitrary session (more details). - In POSIX systems such as Linux, the inspector will be enabled if the process receives
SIGUSR1. This will run in defaultlocalhost:9229unless a different setting is specified with--inspect-port=[HOST:]PORT(more details).
Using command line #
Also, there are other ways to obtain heap snapshots directly, without using developer tools UI. NodeJS allows to pass different command line parameters for programming heap snapshot capture/profiling:
--heapsnapshot-near-heap-limit=Nwill dump a heap snapshot when the V8 heap is close to its maximum size limit. TheNparameter is the number of times it will dump a new snapshot. This is important because, when V8 is reaching the heap limit, it will take measures to free memory through garbage collection, so in a pattern of growing usage we will hit the limit several times.--heapsnapshot-signal=SIGNALwill dump heap snapshots every time the NodeJS process gets the UNIX signalSIGNAL.
We can also record a heap profiling session from the start of the process to the end (same kind of profiling we obtain from Dev Tools using Allocation sampling option) using command line option --heap-prof. This will sample continuously the memory allocations, and can be tuned using different command line parameters as documented here.
Analysis of heap snapshots #
The scope of this post is about how to capture heap snapshots in different scenarios. But… once you have them… You will want to use that information to actually understand memory usage. Here are some good reads about how to use heap snapshots.
First, from Chrome DevTools documentation:
- Memory terminology: it gives a great tour on how memory is allocated, and what heap snapshots try to represent.
- Fix memory problems: this one provides some examples of how to use different tools in Chromium to understand memory usage, including some heap snapshot and profiling examples.
- View snapshots: a high level view of the different heap snapshot and profiling tools.
- How to Use the Allocation Profiler Tool: this one specific to the allocation profiler.
And then, from NodeJS, you have also a couple of interesting things:
- Memory Diagnostics: some of this has been covered in this post, but still has an example of how to find a memory leak using Comparison.
- Heap snapshot exercise: this is an exercise including a memory leak, that you can hunt with heap snapshot.
Recap #
- Memory is a valuable resource that Javascript (both web and NodeJS) application developers may want to profile.
- As usual, when there are resource allocation problems, we need reliable and accurate information about what is happening and when.
- V8 heap snapshots provide such information, integrated with Chromium and NodeJS.
Next #
In a follow up post, I will talk about several optimizations we worked on, that make V8 heap snapshot implementation faster. Stay tuned!
Thanks! #
This work has been thanks to the sponsorship from Igalia and Bloomberg.


