Unlocking 15% More Performance: A Case Study in LLVM Optimization for RISC-V
This blog post summarizes a talk given by Mikhail R. Gadelha at the RISC-V Summit North America 2025.
You can also watch the presentation here. And download the full presentation here.

Introduction #
In this post, I will walk through the results of a 10-month RISE project we completed in September, focused on improving the performance of the LLVM toolchain for RISC-V.
Since the moment I originally submitted this talk, we have actually squeezed out a bit more performance: what used to be a 15% speed-up is now up to 16% on SPEC CPU® 2017. Small change, but still measurable.
The project targeted the Banana Pi BPI-F3 board, which uses the SpacemiT X60: an in-order, 8-core RISC-V processor supporting the RVA22U64 profile and RVV 1.0, 256-bit vectors.
Our high-level goal was straightforward: to reduce the performance gap between LLVM and GCC for RISC-V. However, there wasn't (and still isn't) one single fix; LLVM is an extremely active codebase where improvements and regressions happen constantly. Instead, we focused on three major contributions:
-
A full scheduling model for the SpacemiT X60.
-
Improvements to vectorization across calls.
-
IPRA support for the RISC-V backend.
Let's walk through each contribution.
1. SpacemiT-X60 Scheduling Model #
By far, our main contribution to the LLVM project was the scheduling model for the Spacemit-X60, but before we delve deeper into the changes, let's understand what a scheduling model is.
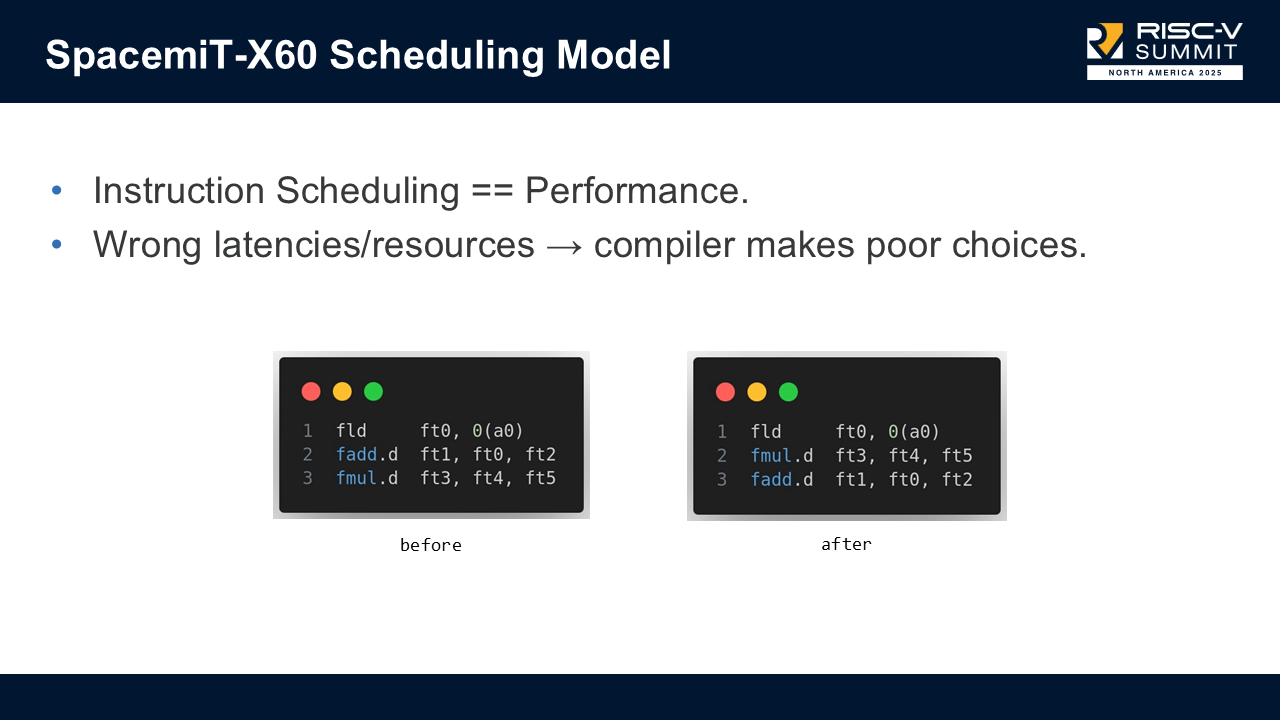
Instruction scheduling directly impacts performance, especially on in-order processors. Without accurate instruction latencies, and instruction resource usage, the compiler can make poor scheduling decisions.
In our slides, there is an example where:
load -> uses ft0
fadd -> depends on ft0
fmul -> independent
The above is a possible naive code generated by the compiler, which has latency(load + fadd + fmul). Thanks to an accurate scheduling model the compiler can reason that it is better to emit the following code with latency(max(load, fmul) + fadd).
load -> uses ft0
fmul -> independent of preceding load
fadd -> depends on load
This was just an illustrative example, not something LLVM typically emits, but it demonstrates how missing scheduling information leads to unnecessary stalls.
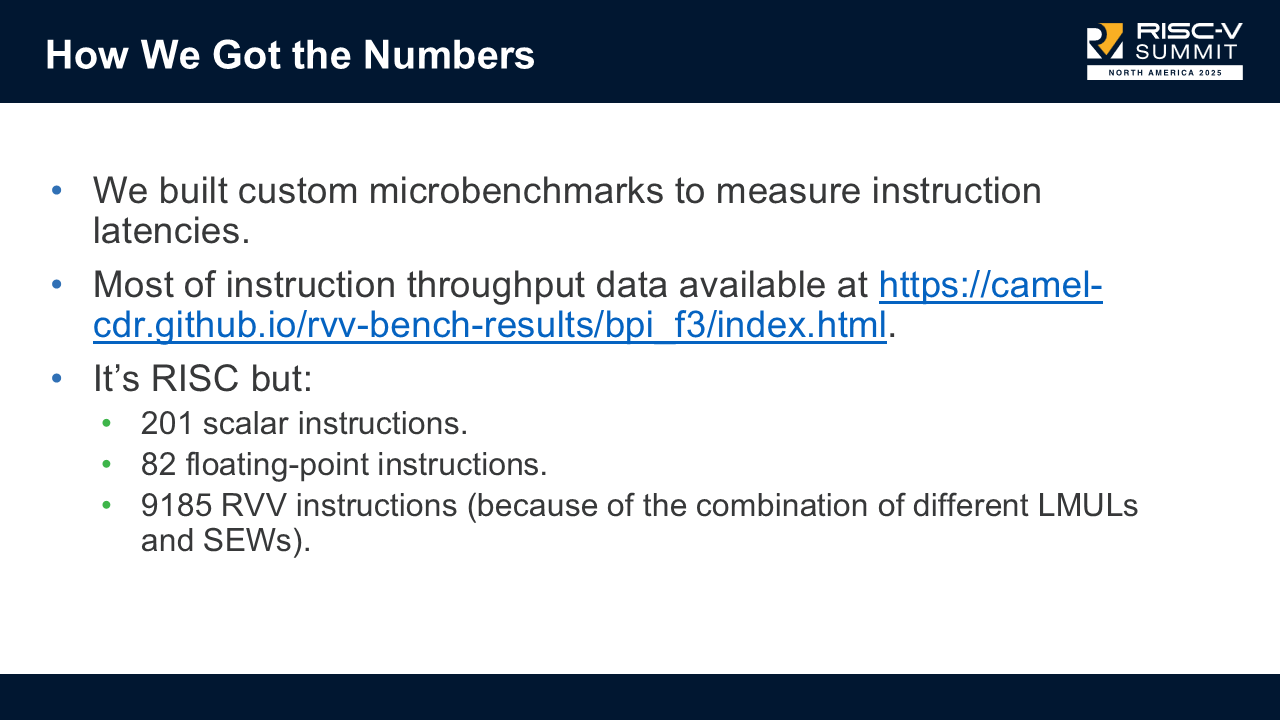
The biggest piece of the work was to actually collect the data on every single instruction supported by the board. To build a correct model, we:
- wrote custom microbenchmarks to measure latency for every instruction.
- used throughput data from camel-cdr's RVV benchmark results.
- tracked all combinations of LMUL × SEW, which leads to:
- 201 scalar instructions.
- 82 FP instructions.
- 9185 RVV "instructions" (combinations).
This resulted in a very, very large spreadsheet, and it took some time to analyse and then produce a series of upstream patches to reflect that data in LLVM.
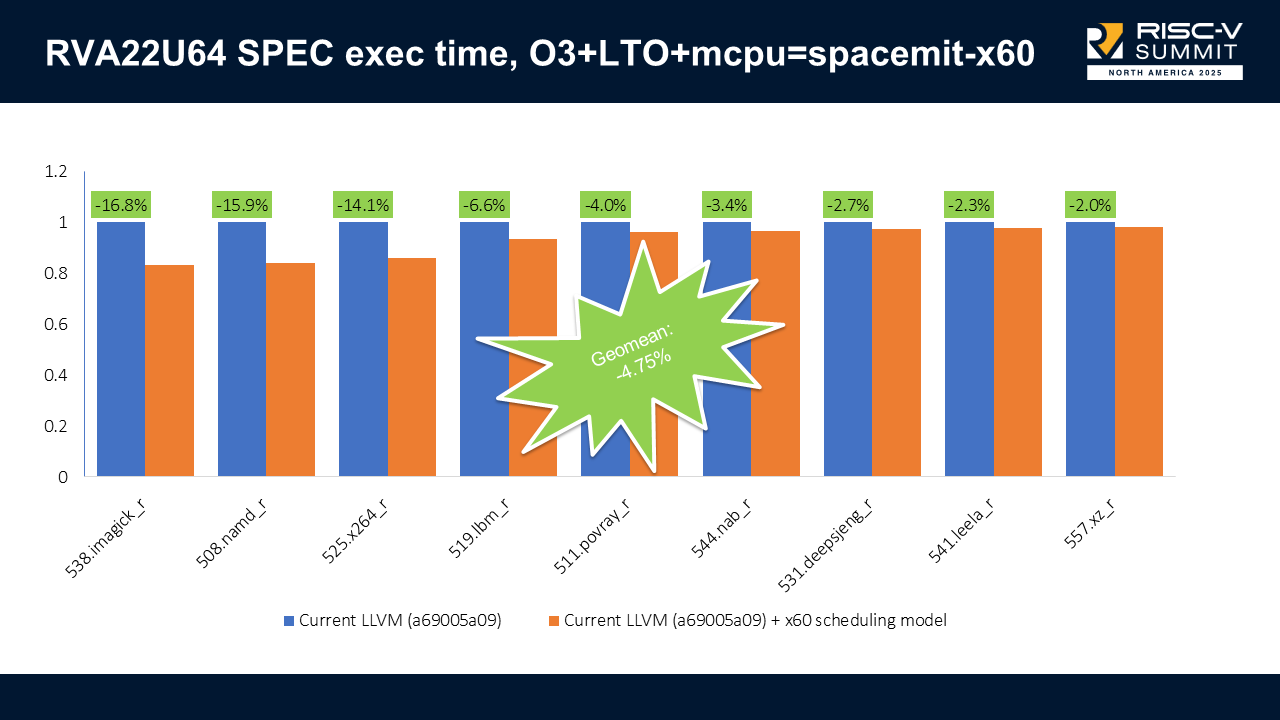
With scheduling enabled on RVA22U64 (scalar-only), we got up to 16.8% execution time improvements (538.imagick_r) and no regressions. The combined results show a -4.75% geometric mean improvement on execution time.
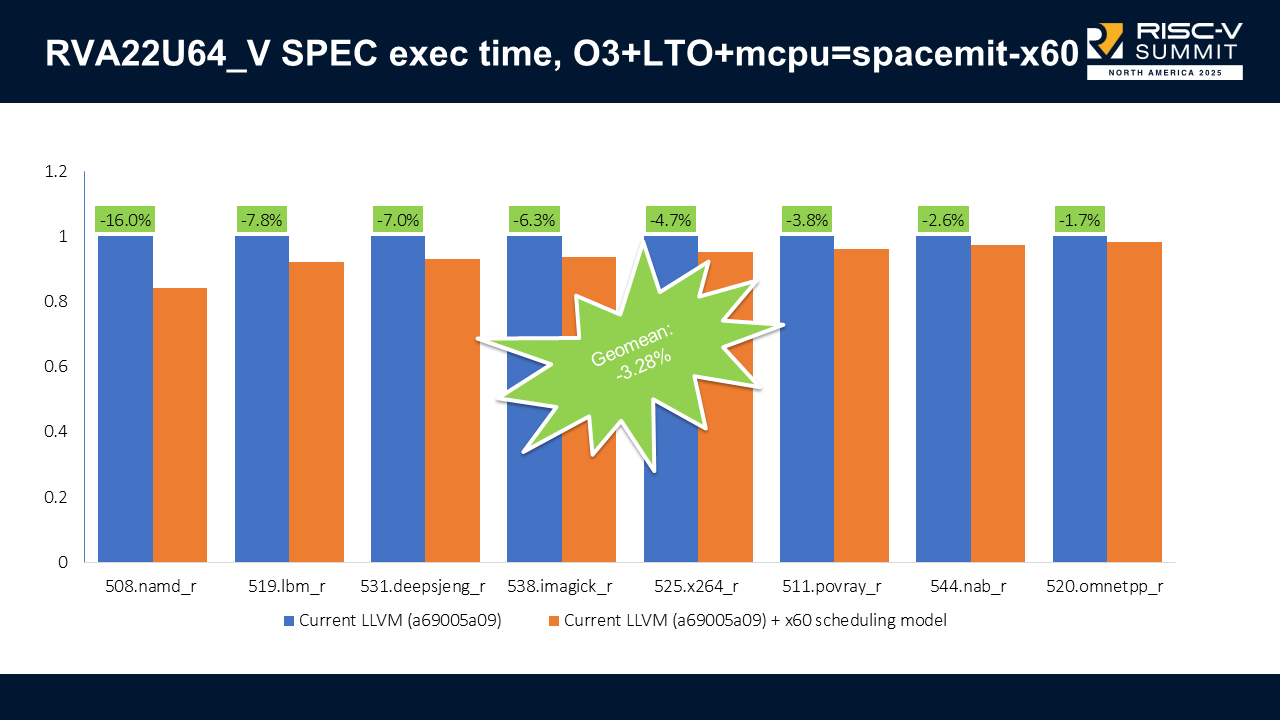
When we enable vectors (RVA22U64_V), we got up to 16% improvement (508.namd_r) and no regressions. The combined results show a -3.28% geometric mean improvement on execution time.
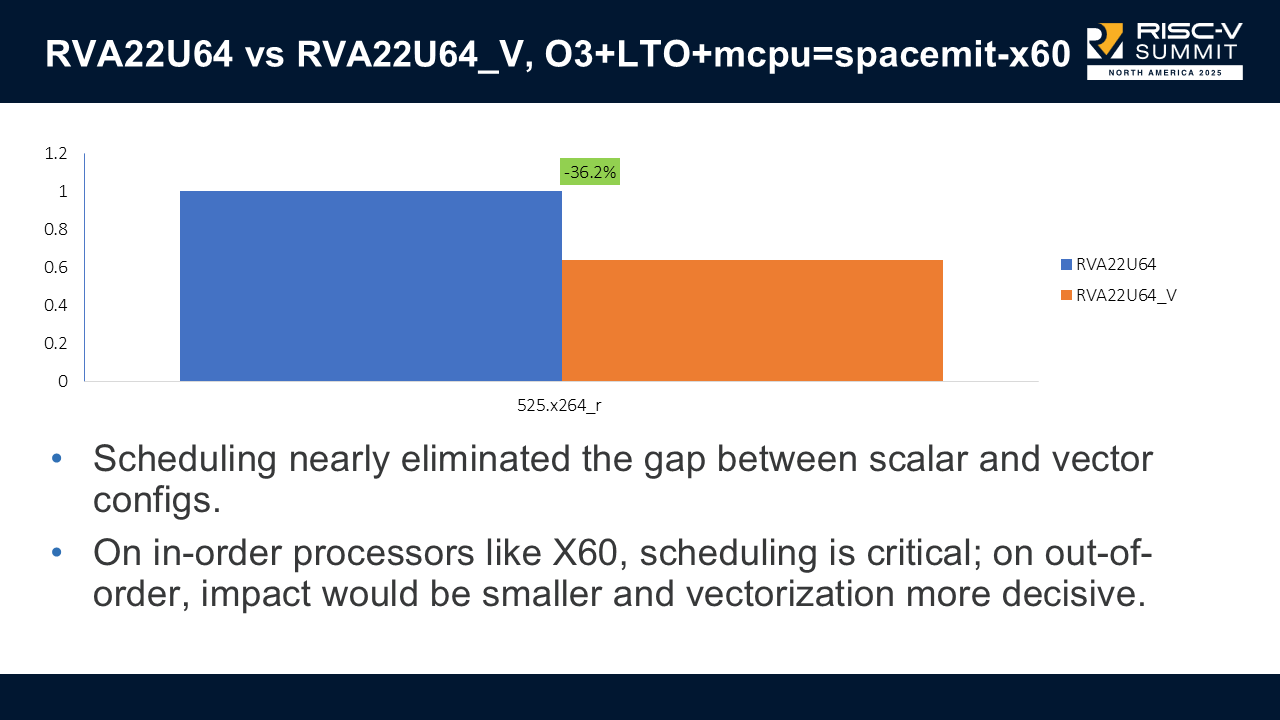
One interesting result: scheduling nearly eliminated the gap between scalar and vector configurations on the x60; only one SPEC benchmark (x264) still favored the vectorized build.
This shows there may be more work in improving our ability to find profitable vectorization.
2. Improving Vectorization Across Calls #
During benchmarking, we found strange cases where scalar code was faster than vectorized code. The root cause: register spills, especially around function call boundaries.
Example: 544.nab_r #
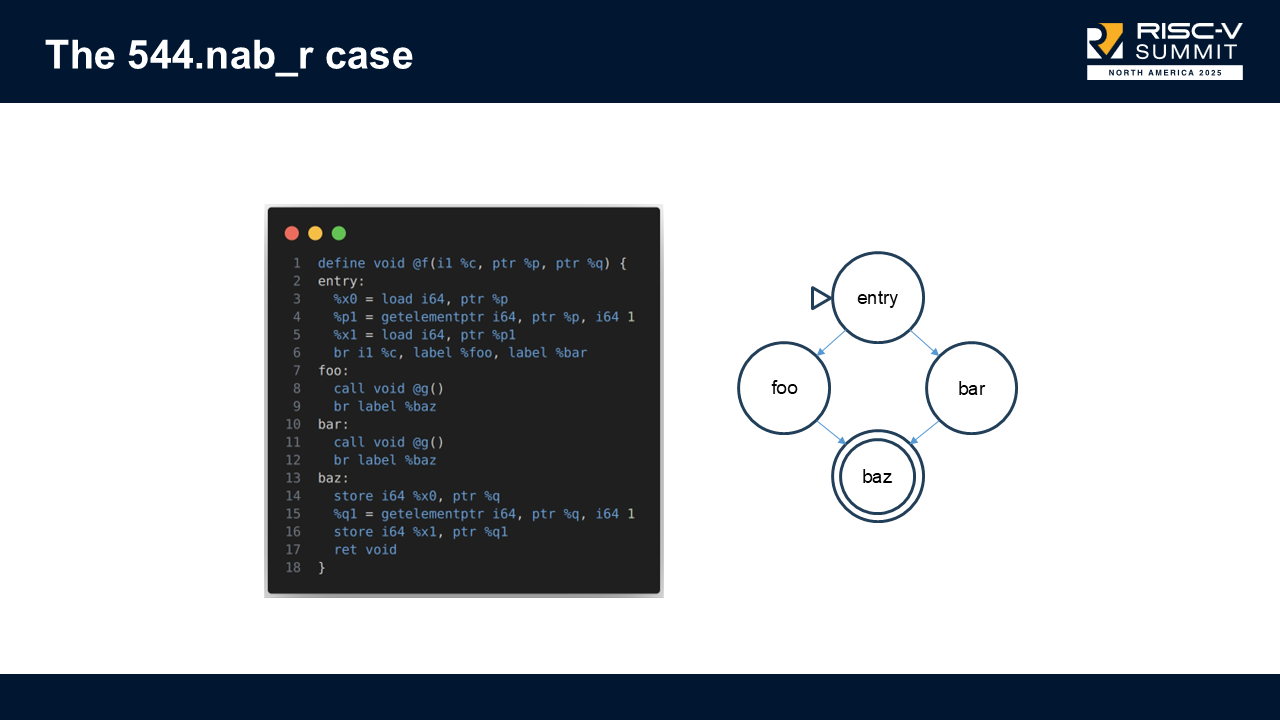
In this function, the SLP vectorizer would look only at the basic blocks performing loads/stores, and ignore the blocks containing function calls in-between blocks.
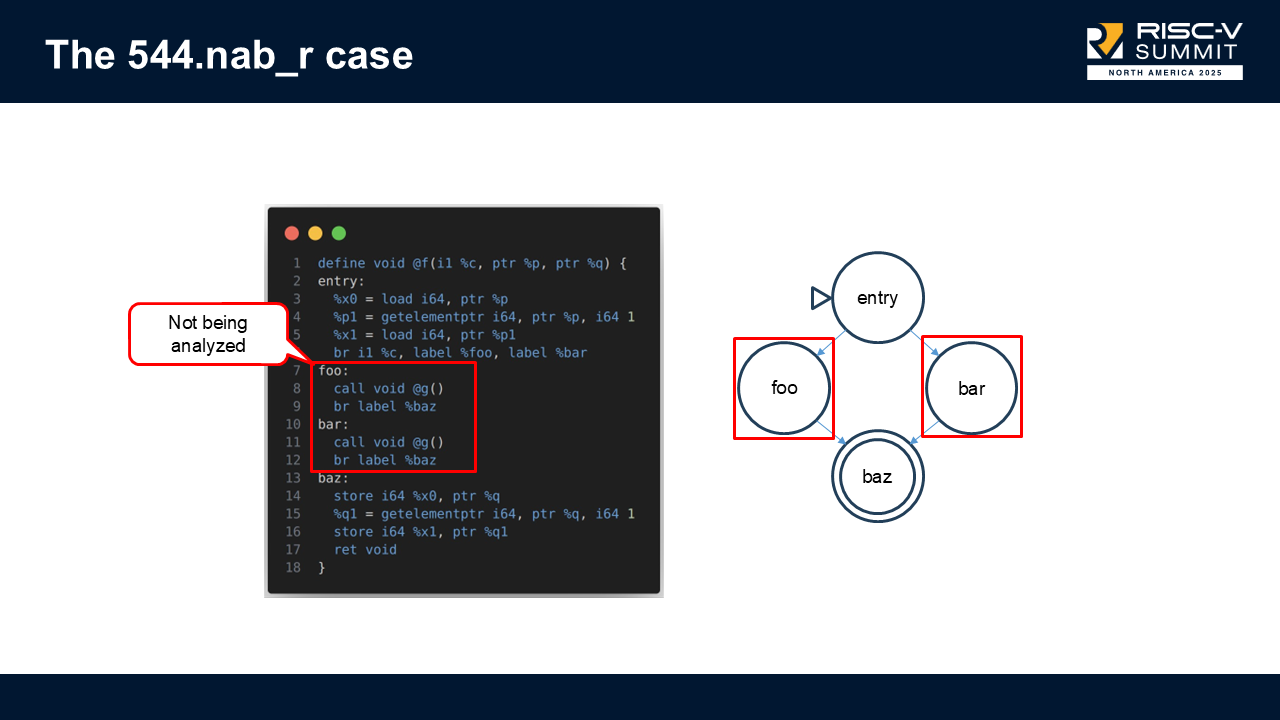
Because those call blocks weren't considered when computing profitability, the vectorizer assumed vectorization was cheap, but in reality, it caused expensive vector register spills.
We modified SLP to walk all blocks in the region and estimate the cost properly. This helped: +9.9% faster on 544.nab_r, but hurt compilation time: +6.9% slower on 502.gcc_r. After discussion, Alexey Bataev (SLP vectorizer maintainer) created a refined version that fixed the issue and avoided compilation slowdowns. This shows how the open-source community is important and that collaboration can take us further.
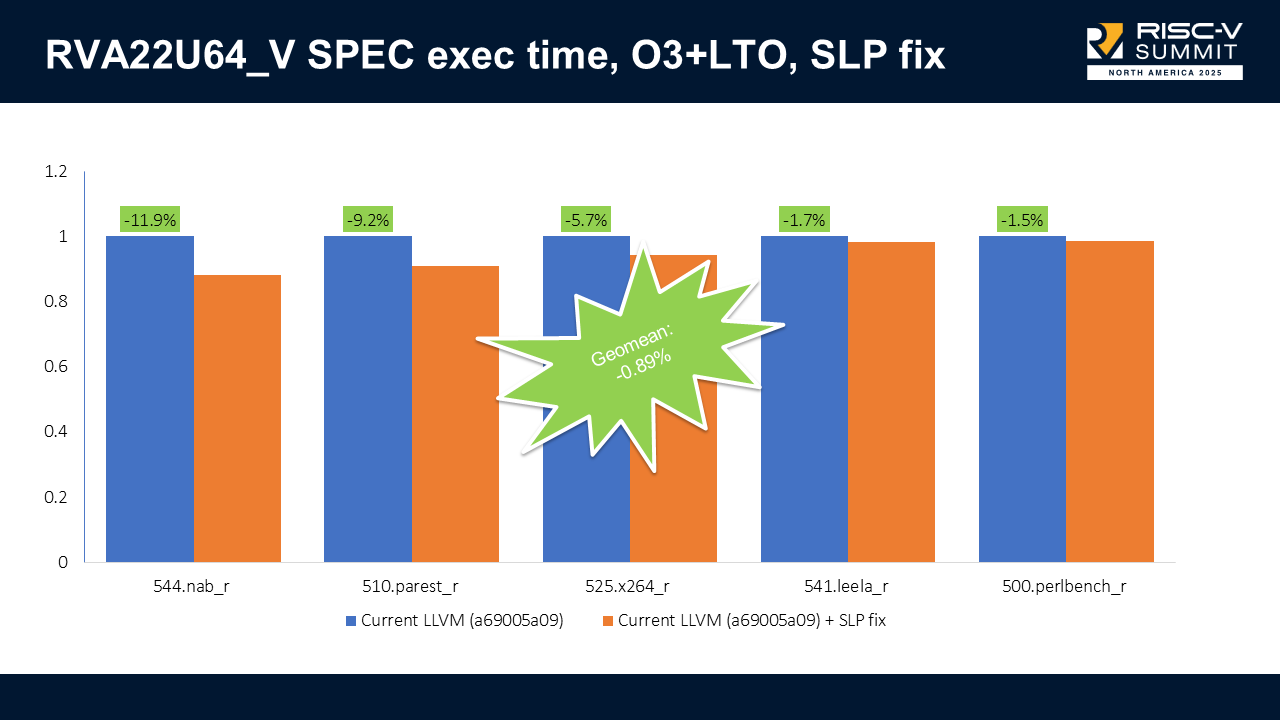
With the refined patch, we got up to 11.9% improvement (544.nab_r), no regressions, with negligible compile-time regressions. The combined results show a -3.28% geometric mean improvement on execution time.
Note that we only show results for RVA22U64_V, because the regression only happened when vectors were enabled. Now, the execution time is on par or better than the scalar-only execution time.
3. IPRA Support (Inter-Procedural Register Allocation) #
IPRA tracks which registers are actually used across call boundaries. Without it, LLVM spills registers conservatively, including registers that aren’t truly live.
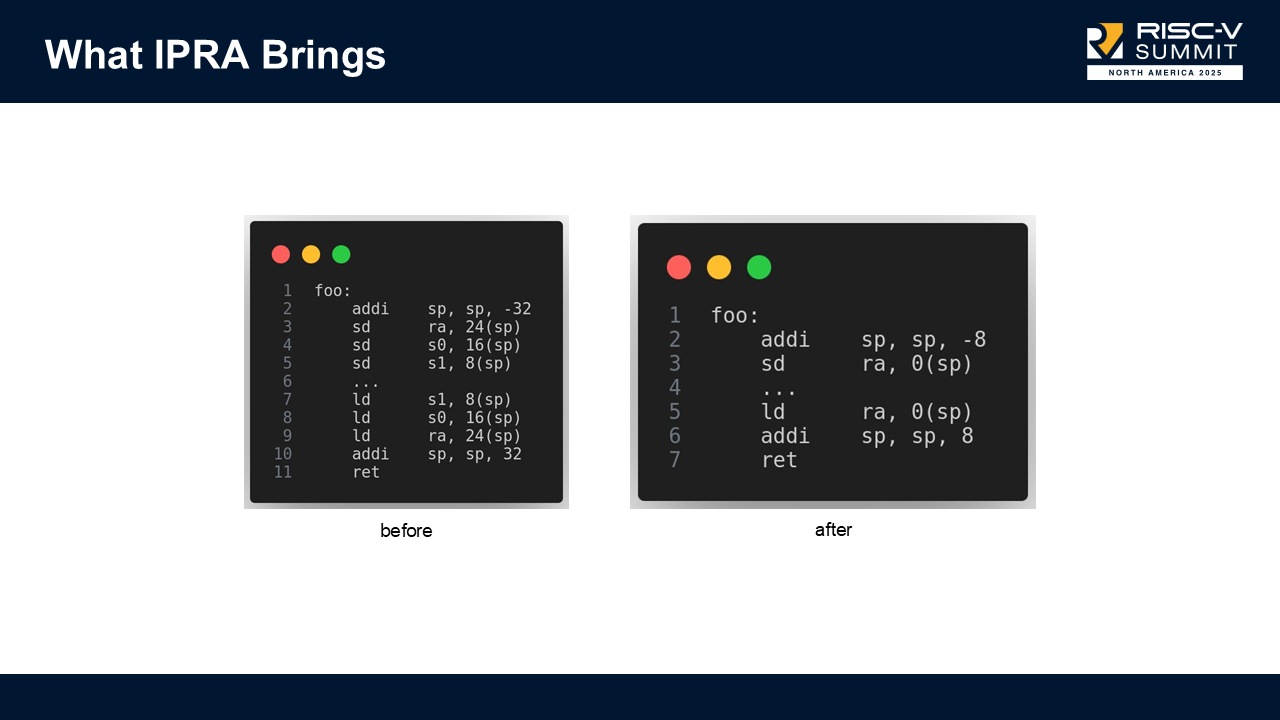
Let's consider the illustrative example above, and assume s0 and s1 are not live in this function. LLVM will still save and restore these registers when IPRA is disabled. By enabling IPRA, we reduce register pressure and create shorter function prologues and epilogues.
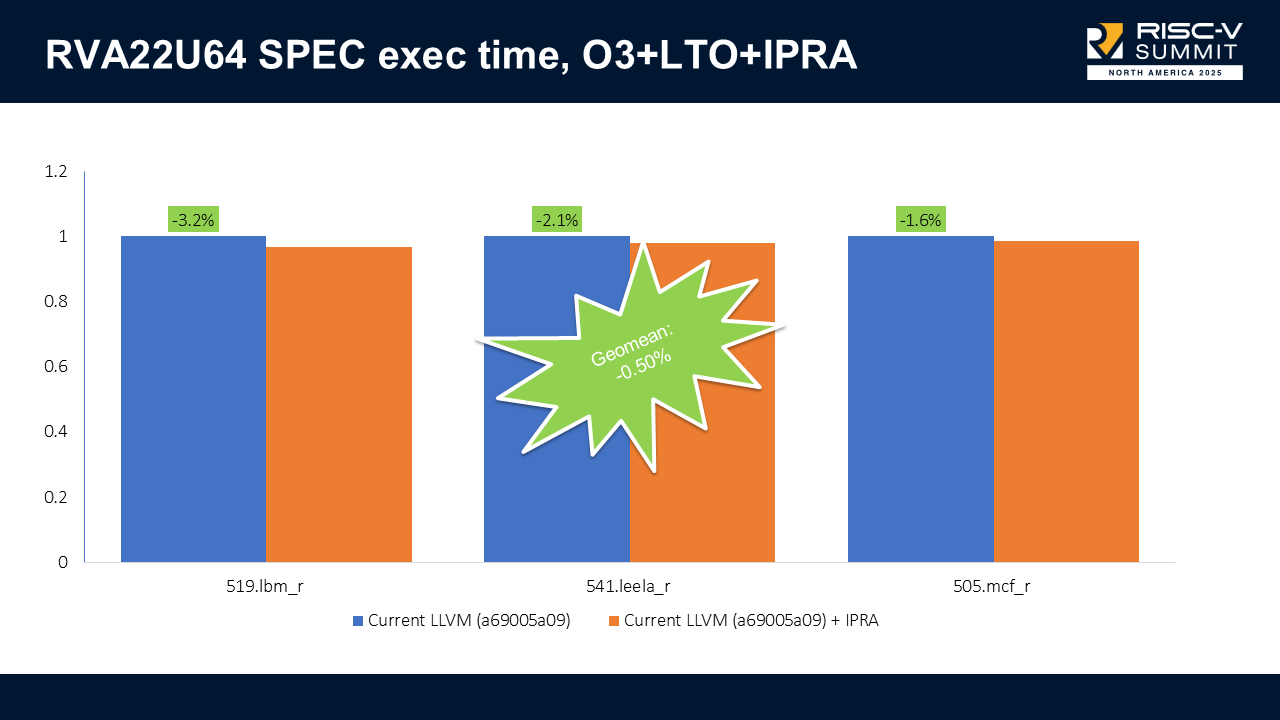
With IPRA enabled on RVA22U64, we got up to 3.2% execution time improvements (538.lbm_r) and no regressions. The combined results show a -0.50% geometric mean improvement on execution time.
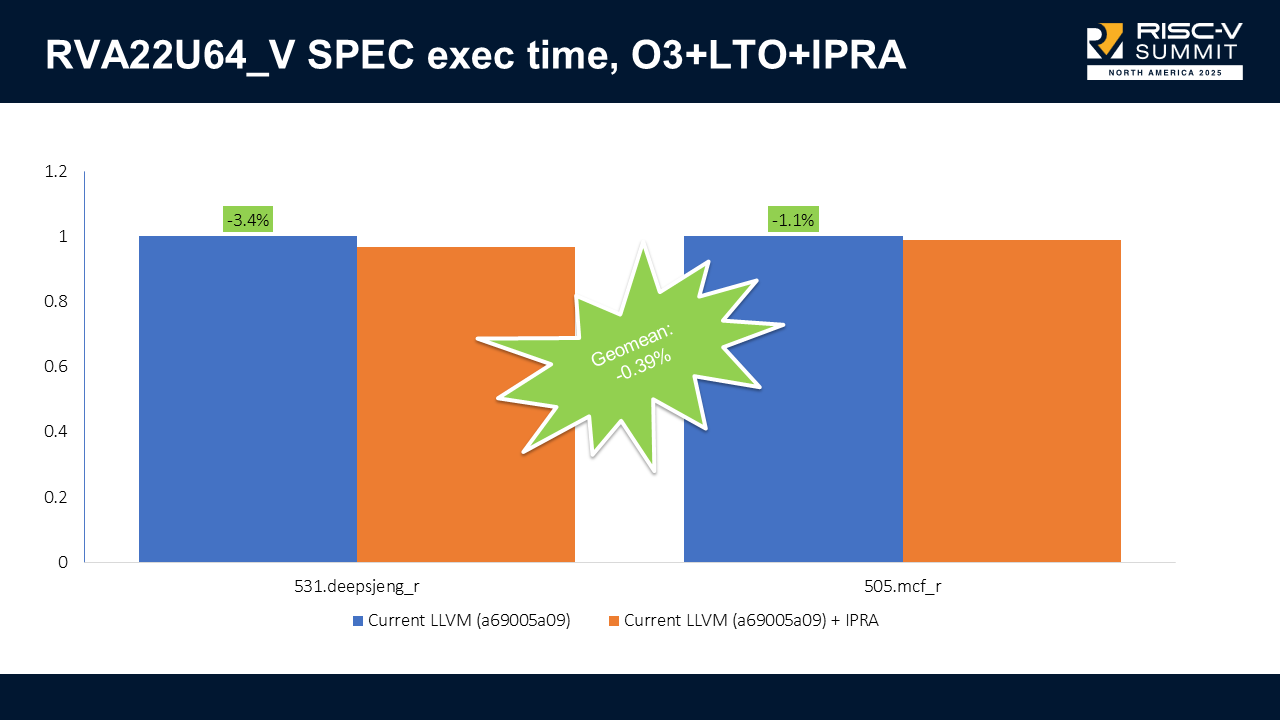
When we enable vectors (RVA22U64_V), we got up to 3.4% improvement (508.deepsjeng_r) and no regressions. The combined results show a -0.39% geometric mean improvement on execution time.
Small but consistent wins; however, IPRA can’t be enabled by default due to an open bug, though it does not affect SPEC.
LLVM vs GCC #
This comparison isn’t perfectly apples-to-apples because LLVM has X60-specific scheduling and GCC does not. Still, it's useful to see progress.
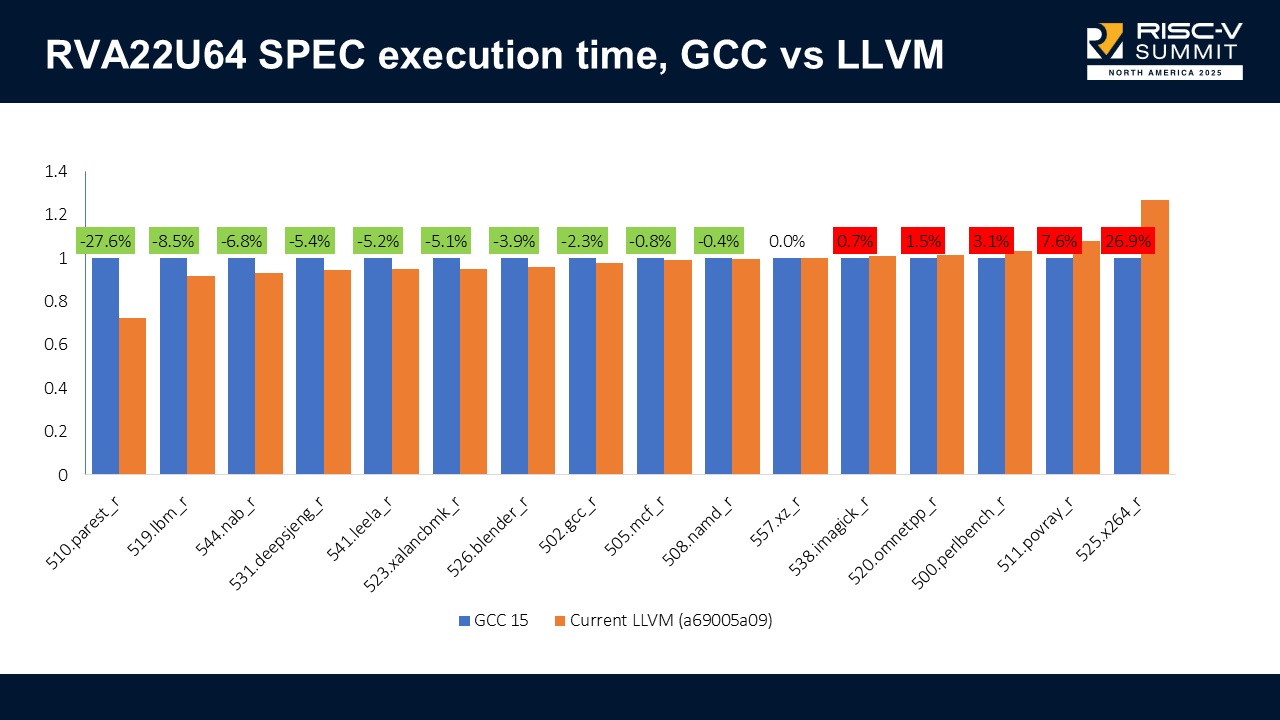
On RVA22U64, LLVM can be 27% faster on some benchmarks but also 27% slower on others (notably x264).
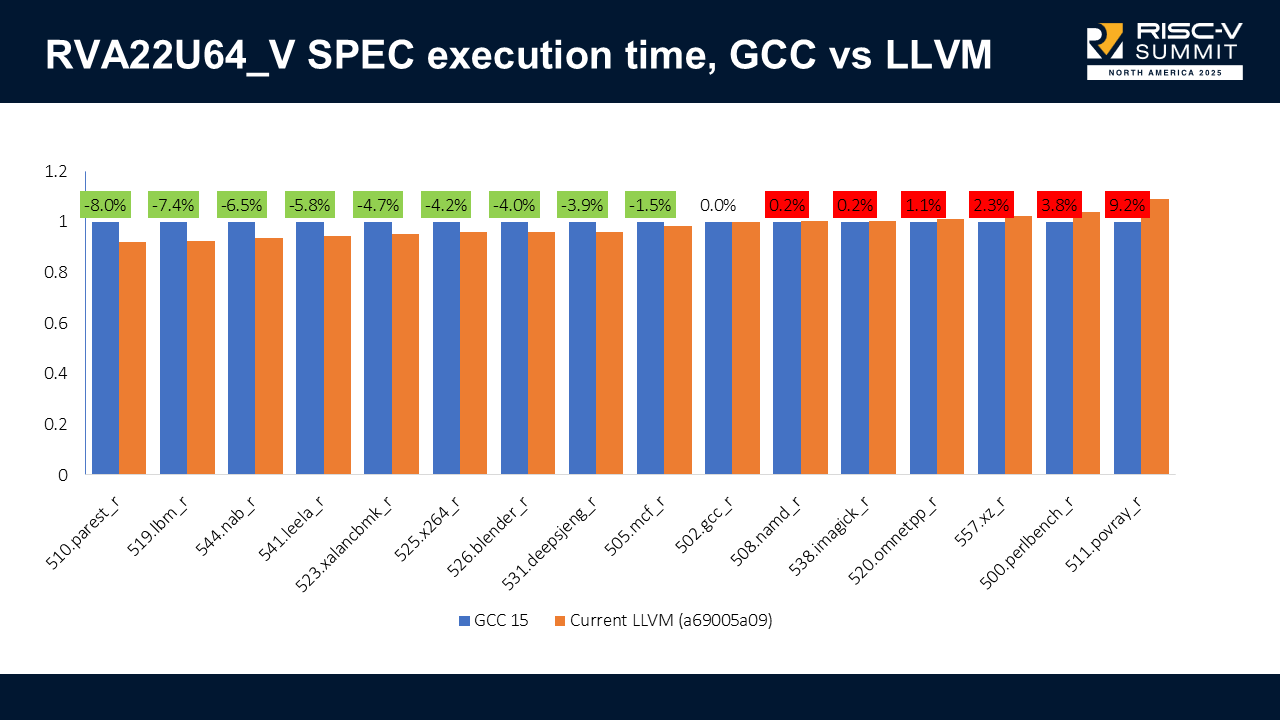
The results when we enable vectors (RVA22U64_V) are similar: LLVM can be 8% faster in some benchmarks but also 9.2% slower in others.
My colleague Luke Lau is currently investigating these results to try to address the cases where we are slower.
What we learned #
-
Adding a scheduling model can give meaningful performance improvements, especially for in-order cores.
-
A default in-order scheduling model may be needed. Other backends do this already, and we have a PR open for that at PR#167008.
-
Many contributions don’t show results until the entire system comes together. When the project started, I spent some time modeling individual instruction, but only when the full model was integrated did we see actual improvements.
-
Vectorization must be tuned carefully; incorrect cost modeling leads to regressions.
Thank you #
Thank you for reading!