Boosting RISC-V Application Performance: An 8-Month LLVM Journey
Over the past eight months, Igalia has been working through RISE on the LLVM compiler, focusing on its RISC-V target. The goal is to improve the performance of generated code for application-class RISC-V processors, especially where there are gaps between LLVM and GCC RISC-V. The result? A set of improvements that reduces execution time by up to 15% on our SPEC CPU® 2017-based benchmark harness.
In this blog post, I’ll walk through the challenges, the work we did across different areas of LLVM (including instruction scheduling, vectorization, and late-stage optimizations), and the resulting performance gains that demonstrate the power of targeted compiler optimization for the RISC-V architecture on current RVA22U64+V and future RVA23 hardware.
Understanding the Landscape #
First, to understand the work involved in optimizing the RISC-V performance, let’s briefly discuss the key components of this project: the RISC-V architecture itself, the LLVM compiler infrastructure, and the Banana Pi BPI-F3 board as our target platform.
The RISC-V Architecture #
RISC-V is a modern, open-standard instruction set architecture (ISA) built around simplicity and extensibility. Unlike proprietary ISAs, RISC-V’s modular design allows implementers to choose from base instruction sets (e.g., RV32I, RV64I) and optional extensions (e.g., vector ops, compressed instructions). This flexibility makes it ideal for everything from microcontrollers to high-performance cores, while avoiding the licensing hurdles of closed ISAs. However, this flexibility also creates complexity: without guidance, developers might struggle to choose the right combination of extensions for their hardware.
Enter RISC-V Profiles: standardized bundles of extensions that ensure software compatibility across implementations. For the BPI-F3’s CPU, the relevant profile is RVA22U64, which includes:
- Mandatory: RV64GC (64-bit with general-purpose + compressed instructions), Zicsr (control registers), Zifencei (instruction-fetch sync), and more.
- Optional: The Vector extension (V) v1.0 (for SIMD operations) and other accelerators.
We chose to focus our testing on two configurations: RVA22U64 (scalar) and RVA22U64+V (vector), since they cover a wide variety of hardware. It's also important to note that code generation for vector-capable systems (RVA22U64+V) differs significantly from scalar-only targets, making it crucial to optimize both paths carefully.
RVA23U64, which mandates the vector extension, was not chosen because the BPI-F3 doesn’t support it.
The LLVM compiler #
LLVM is a powerful and widely used open-source compiler infrastructure. It's not a single compiler but rather a collection of modular and reusable compiler and toolchain technologies. LLVM's strength lies in its flexible and well-defined architecture, which allows it to efficiently compile code written in various source languages (like C, C++, Rust, etc.) for a multitude of target architectures, including RISC-V. A key aspect of LLVM is its optimization pipeline. This series of analysis and transformation passes works to improve the generated machine code in various ways, such as reducing the number of instructions, improving data locality, and exploiting target-specific hardware features.
The Banana Pi BPI-F3 #
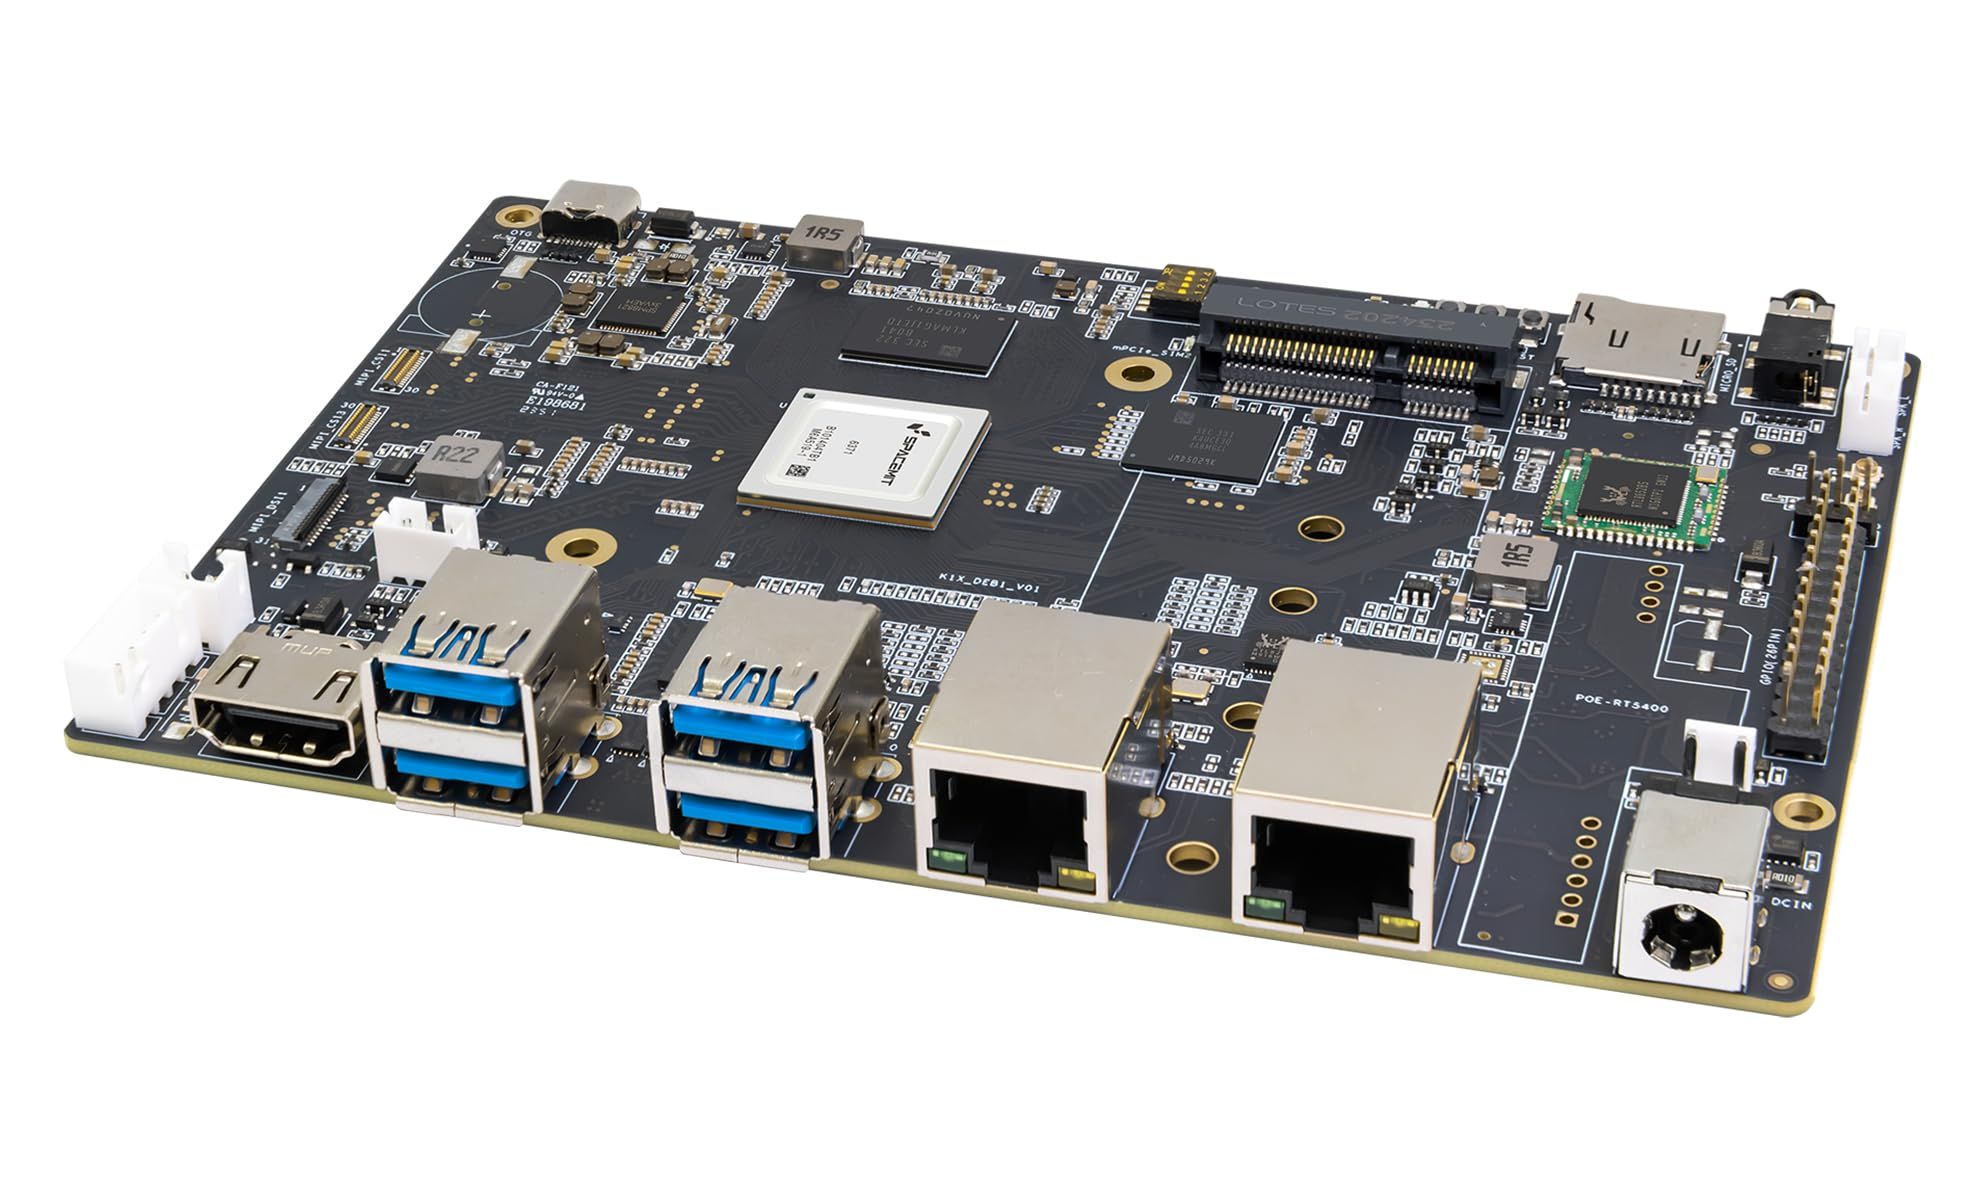
The Banana Pi BPI-F3 is a board featuring a SpacemiT K1 8-core RISC-V chip: PU integrates 2.0 TOPs AI computing power. 2/4/8/16G DDR and 8/16/32/128G eMMC onboard.2x GbE Ethernet port, 4x USB 3.0 and PCIe for M.2 interface, support HDMI and Dual MIPI-CSI Camera.
Most notably, the RISC-V CPU supports the RVA22U64 Profile and 256-bit RVV 1.0 standard.
8 Months of Optimizations #
Let's define the testing environment. We use the training dataset on SPEC CPU® 2017-based benchmark to measure the impact of changes to the LLVM codebase. We do not use the reference dataset for practical reasons, i.e., the training dataset finishes in hours instead of days.
The benchmarks were executed on the BPI-F3, running Arch Linux and Kernel 6.1.15. The configuration of each compiler invocation is as follows:
- LLVM at the start of the project (commit cd0373e0): SPEC benchmarks built with optimization level 3 (-O3), and LTO enabled (-flto). We’ll show the results using both RVA22U64 (-march=rva22u64) and the RVA22U64+V profiles (-march=rva22u64_v).
- LLVM today (commit b48c476f): SPEC benchmarks built with optimization level 3 (-O3), LTO enabled (-flto), tuned for the SpacemiT-X60 (-mcpu=spacemit-x60), and IPRA enabled (-mllvm -enable-ipra -Wl,-mllvm,-enable-ipra). We’ll also show the results using both RVA22U64 (-march=rva22u64) and the RVA22U64+V profile (-march=rva22u64_v).
- GCC 14.2: SPEC benchmarks built with optimization level 3 (-O3), and LTO enabled (-flto). GCC 14.2 doesn't support profile names in -march, so a functionally equivalent ISA naming string was used (skipping the assortment of extensions that don't affect codegen and aren't recognised by GCC 14.2) for both RVA22U64 and RVA22U64+V.
The following graph shows the improvements in execution time of the SPEC benchmarks from the start of the project (light blue bar) to today (dark blue bar) using the RVA22U64 profile, on the BPI-F3. Note that these include not only my contributions but also the improvements of all other individuals working on the RISC-V backend. We also include the results of GCC 14.2 for comparison (orange bar). Our contributions will be discussed later.
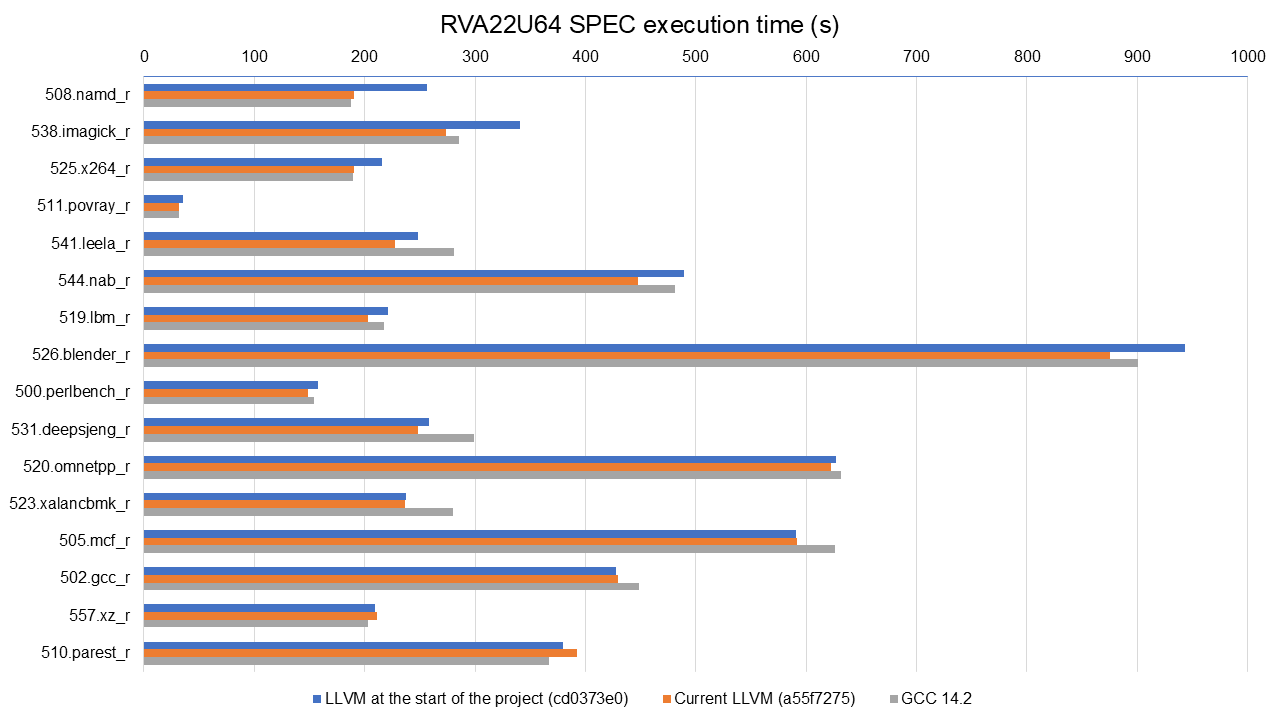
Full data available at https://lnt.lukelau.me/db_default/v4/nts/507?compare_to=494, including code size gains.
The graph is sorted by the execution time improvements brought by the new scheduling model. We see improvements across almost all benchmarks, from small gains in 531.deepsjeng_r (3.63%) to considerable ones in 538.imagick_r (19.67%) and 508.namd_r (25.73%). There were small regressions in the execution time of 510.parest_r (-3.25%); however, 510.parest_r results vary greatly in daily tests, so it might be just noise. Five benchmarks are within 1% of previous results, so we assume there was no impact on their execution time.
When compared to GCC, LLVM today is faster in 11 out of the 16 tested benchmarks (up to 23.58% faster than GCC in 541.leela_r), while being slower in three benchmarks (up to 6.51% slower than GCC in 510.parest_r). Current LLVM and GCC are within 1% of each other in the other two benchmarks. Compared to the baseline of the project, GCC was faster in ten benchmarks (up to 26.83% in 508.namd_r) while being slower in only five.
Similarly, the following graph shows the improvements in the execution time of SPEC benchmarks from the start of the project (light blue bar) to today (dark blue bar) on the BPI-F3, but this time with the RVA22U64+V profile, i.e., the RVA22U64 plus the vector extension (V) enabled. Again, GCC results are included (orange bar), and the graph shows all improvements gained during the project.
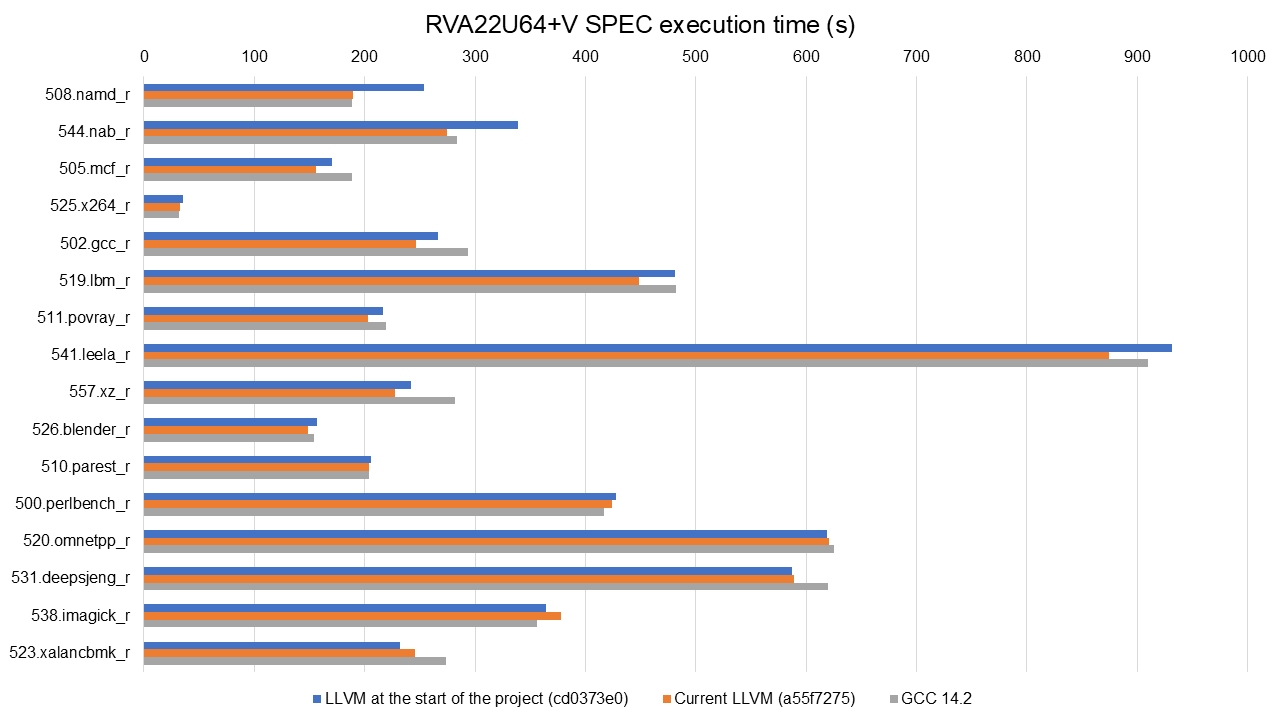
Full data available at https://lnt.lukelau.me/db_default/v4/nts/527?compare_to=500, including code size gains.
The graph is sorted by the execution time improvements brought by the new scheduling model. The results for RVA22U64+V follow a similar trend, and we see improvements in almost all benchmarks. From 4.91% in 500.perlbench_r to (again) a considerable 25.26% improvement in 508.namd_r. Similar to the RVA22U64 results, we see a couple of regressions: 510.parest_r with (-3.74%) and 523.xalancbmk_r (-6.01%). Similar to the results on RVA22U64, 523.xalancbmk_r, and 510.parest_r vary greatly in daily tests on RVA22u64+V, so these regressions are likely noise. Four benchmarks are within 1% of previous results, so we assume there was no impact on their execution time.
When compared to GCC, LLVM today is faster in 10 out of the 16 tested benchmarks (up to 23.76% faster than GCC in 557.xz_r), while being slower in three benchmark (up to 5.58% slower in 538.imagick_r). LLVM today and GCC are within 1-2% of each other in the other three benchmarks. Compared to the baseline of the project, GCC was faster in eight benchmarks (up to 25.73% in 508.namd_r) while being slower in five.
Our Contributions #
Over the past eight months, our efforts have concentrated on several key areas within the LLVM compiler infrastructure to specifically target and improve the efficiency of RISC-V code generation. These contributions have involved delving into various stages of the compilation process, from instruction selection to instruction scheduling. Here, we'll focus on three major areas where substantial progress has been made:
Introducing a scheduling model for the hardware used for benchmarking (SpacemiT-X60): LLVM had no scheduling model for the SpacemiT-X60, leading to pessimistic and inefficient code generation. We added a model tailored to the X60’s pipeline, allowing LLVM to better schedule instructions and improve performance. Longer term, a more generic in-order model could be introduced in LLVM to help other RISC-V targets that currently lack scheduling information, similar to how it’s already done for other targets, e.g., Aarch64. This contribution alone brings up to 15.76% improvement on the execution time of SPEC benchmarks.
Improved Vectorization Efficiency: LLVM’s SLP vectorizer used to skip over entire basic blocks when calculating spill costs, leading to inaccurate estimations and suboptimal vectorization when functions were present in the skipped blocks. We addressed this by improving the backward traversal to consider all relevant blocks, ensuring spill costs were properly accounted for. The final solution, contributed by the SLP Vectorizer maintainer, was to fix the issue without impacting compile times, unlocking better vectorization decisions and performance. This contribution brings up to 11.87% improvement on the execution time of SPEC benchmarks.
Register Allocation with IPRA Support: enabling Inter-Procedural Register Allocation (IPRA) to the RISC-V backend. IPRA reduces save/restore overhead across function calls by tracking which registers are used. In the RISC-V backend, supporting IPRA required implementing a hook to report callee-saved registers and prevent miscompilation. This contribution brings up to 3.42% improvement on the execution time of SPEC benchmarks.
SpacemiT-X60 Scheduler Model #
PR: https://github.com/llvm/llvm-project/pull/137343
The biggest contribution so far is the scheduler modeling tailored for the SpacemiT-X60. This scheduler is integrated into LLVM's backend and is designed to optimize instruction ordering based on the specific characteristics of the X60 CPU.
The scheduler was introduced in PR 137343. It includes detailed scheduling models that account for the X60's pipeline structure, instruction latencies for all scalar instructions, and resource constraints. The current scheduler model does not include latencies for vector instructions, but it is a planned future work. By providing LLVM with accurate information about the target architecture, the scheduler enables more efficient instruction scheduling, reducing pipeline stalls and improving overall execution performance.
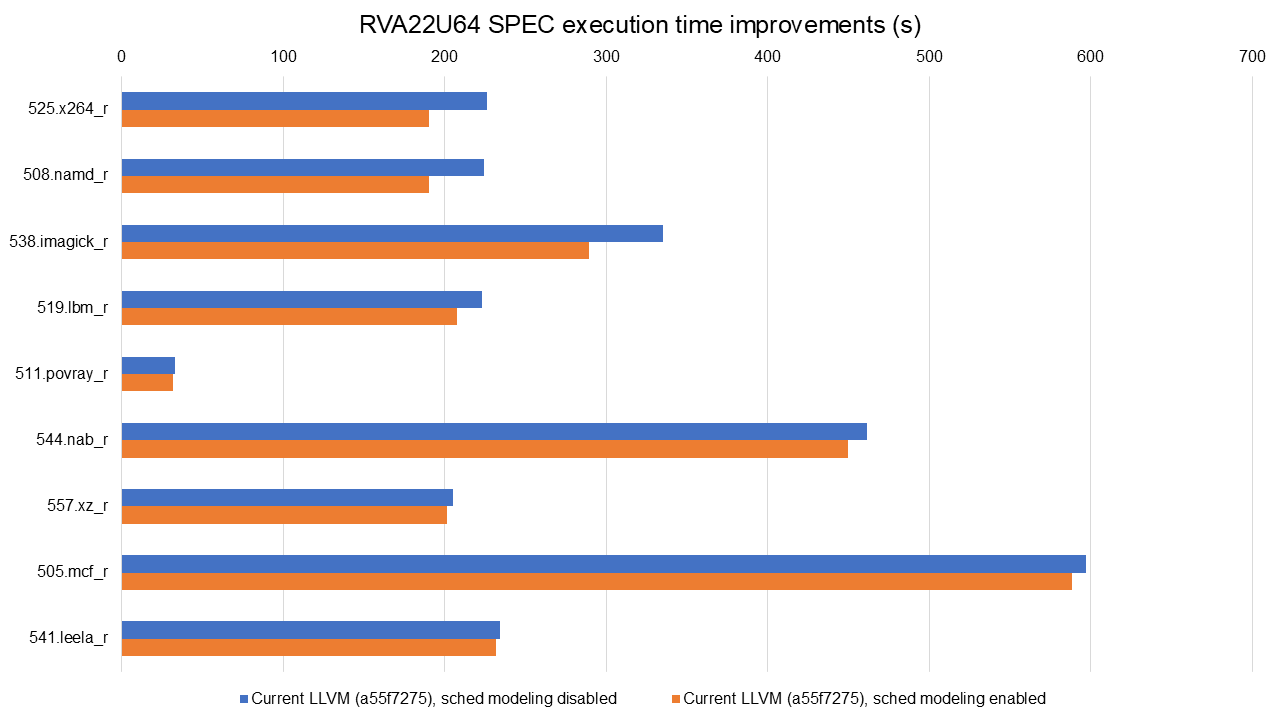
Full data available at https://lnt.lukelau.me/db_default/v4/nts/471?compare_to=405.
The graph is sorted by the execution time improvements brought by the new scheduling model. The introduction of a dedicated scheduler yielded substantial performance gains. Execution time improvements were observed across several benchmarks, ranging from 1.04% in 541.leela_r to 15.76% in 525.x264_r.
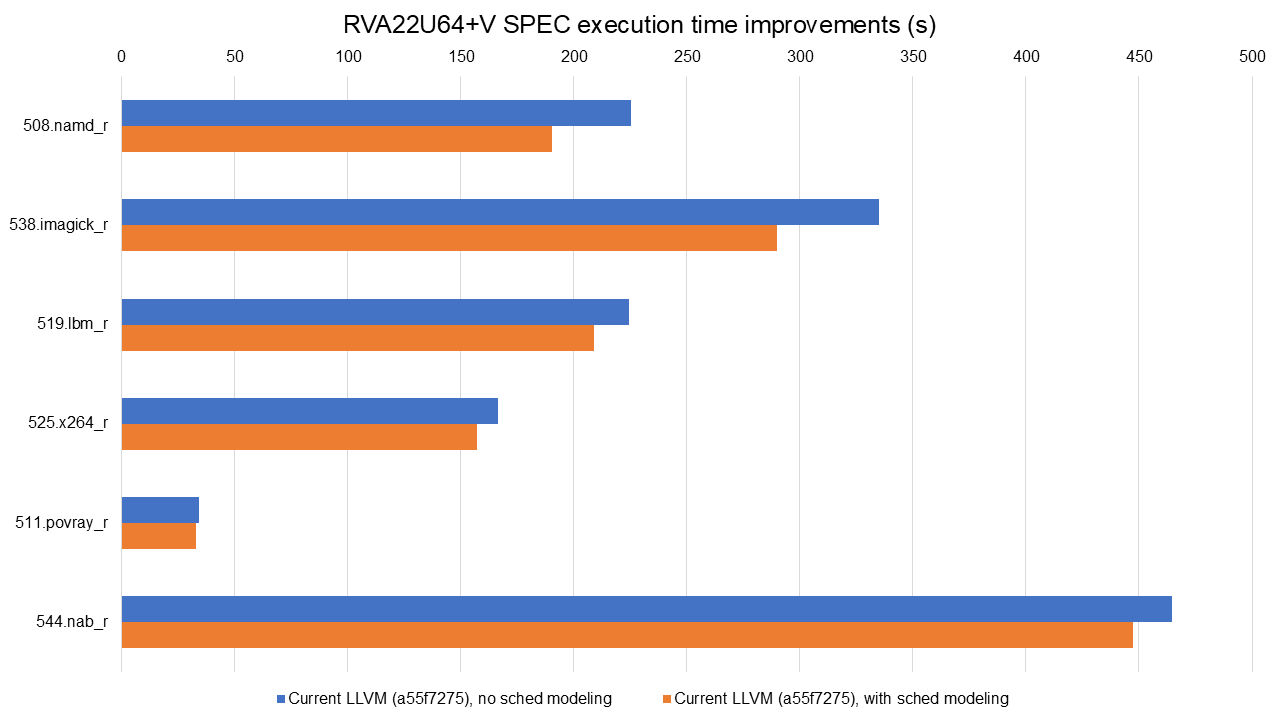
Full data available at https://lnt.lukelau.me/db_default/v4/nts/474?compare_to=404.
Additionally, the scheduler brings significant benefits even when vector extensions are enabled, as shown above. The graph is sorted by the execution time improvements brought by the new scheduling model. Execution time improvements range from 3.66% in 544.nab_r to 15.58% in 508.namd_r, with notable code size reductions as well, e.g., a 6.47% improvement in 519.lbm_r (due to decreased register spilling).
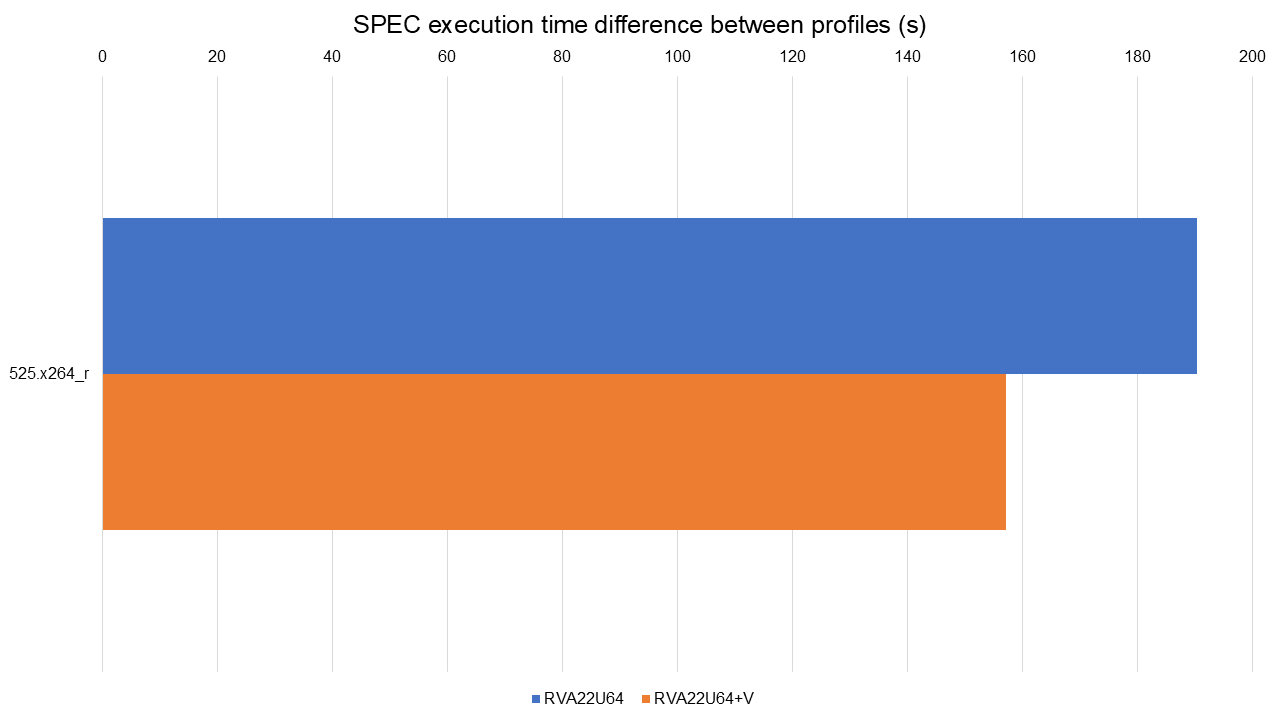
Full data available at: https://lnt.lukelau.me/db_default/v4/nts/474?compare_to=471.
Finally, the previous graph shows the comparison between RVA22U64 vs RVA22U64+V, both with the X60 scheduling model enabled. The only difference is 525.x264_r: it is 17.48% faster on RVA22U64+V.
A key takeaway from these results is the critical importance of scheduling for in-order processors like the SpacemiT-X60. The new scheduler effectively closed the performance gap between the scalar (RVA22U64) and vector (RVA22U64+V) configurations, with the vector configuration now outperforming only in a single benchmark (525.x264_r). On out-of-order processors, the impact of scheduling would likely be smaller, and vectorization would be expected to deliver more noticeable gains.
SLP Vectorizer Spill Cost Fix + DAG Combiner Tuning #
PR 1 (not landed): https://github.com/llvm/llvm-project/pull/128620 PR 2 (landed): https://github.com/llvm/llvm-project/pull/129258 PR 3 (landed): https://github.com/llvm/llvm-project/pull/130430
One surprising outcome in early benchmarking was that scalar code sometimes outperformed vectorized code, despite RISC-V vector support being available. This result prompted a detailed investigation.
Using profiling data, we noticed increased cycle counts around loads and stores in vectorized functions; the extra cycles were due to register spilling, particularly around function call boundaries. Digging further, we found that the SLP Vectorizer was aggressively vectorizing regions without properly accounting for the cost of spilling vector registers across calls.
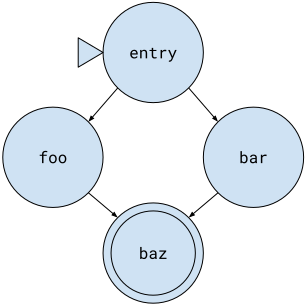
To understand how spill cost miscalculations led to poor vectorization decisions, consider this simplified function, and its graph representation:
declare void @g()define void @f(i1 %c, ptr %p, ptr %q) {entry:%x0 = load i64, ptr %p %p1 = getelementptr i64, ptr %p, i64 1 %x1 = load i64, ptr %p1 br i1 %c, label %foo, label %barfoo: call void @g() br label %bazbar: call void @g() br label %bazbaz: store i64 %x0, ptr %q %q1 = getelementptr i64, ptr %q, i64 1 store i64 %x1, ptr %q1 ret void} |
 |
|---|
This function loads two values from %p, conditionally calls @g() (in both foo and bar), and finally stores the values to %q. Previously, the SLP vectorizer only analyzed the entry and baz blocks, ignoring foo and bar entirely. As a result, it missed the fact that both branches contain a call, which increases the cost of spilling vector registers. This led LLVM to vectorize loads and stores here, introducing unprofitable spills across the calls to @g().
To address the issue, we first proposed PR 128620, which modified the SLP vectorizer to properly walk through all basic blocks when analyzing cost. This allowed the SLP vectorizer to correctly factor in function calls and estimate the spill overhead more accurately.
The results were promising: execution time dropped by 9.92% in 544.nab_r, and code size improved by 1.73% in 508.namd_r. However, the patch also increased compile time in some cases (e.g., +6.9% in 502.gcc_r), making it unsuitable for upstream merging.
Following discussions with the community, Alexey Bataev (SLP Vectorizer code owner) proposed a refined solution in PR 129258. His patch achieved the same performance improvements without any measurable compile-time overhead and was subsequently merged.
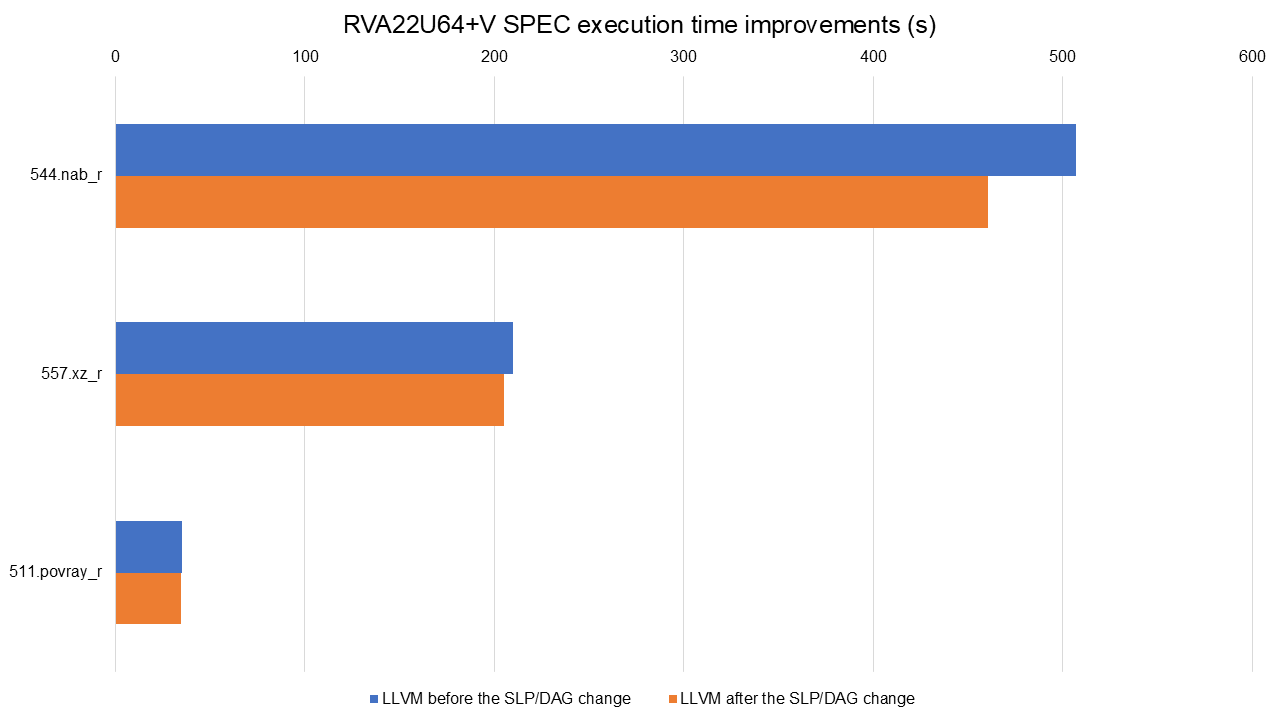
Full data available at https://lnt.lukelau.me/db_default/v4/nts/288?compare_to=281.
The graph shows execution time improvements from Alexey’s patch, ranging from 1.49% in 500.perlbench_r to 11.87% in 544.nab_r. Code size also improved modestly, with a 2.20% reduction in 508.namd_r.
RVA22U64 results are not shown since this is an optimization tailored to prevent the spill of vectors. Scalar code was not affected by this change.
Finally, PR 130430 addressed the same issue in the DAG Combiner by preventing stores from being merged across call boundaries. While this change had minimal impact on performance in the current benchmarks, it improves code correctness and consistency and may benefit other workloads in the future.
IPRA (Inter-Procedural Register Allocation) Support #
GitHub PR: https://github.com/llvm/llvm-project/pull/125586
Inter-Procedural Register Allocation (IPRA) is a compiler optimization technique that aims to reduce the overhead of saving and restoring registers across function calls. By analyzing the entire program, IPRA determines which registers are used across function boundaries, allowing the compiler to avoid unnecessary save/restore operations.
In the context of the RISC-V backend in LLVM, enabling IPRA required implementing a hook in LLVM. This hook informs the compiler that callee-saved registers should always be saved in a function, ensuring that critical registers like the return address register (ra) are correctly preserved. Without this hook, enabling IPRA would lead to miscompilation issues, e.g., 508.namd_r would never finish running (probably stuck in an infinite loop).
To understand how IPRA works, consider the following program before IPRA. Let’s assume function foo uses s0 but doesn't touch s1:
# Function bar calls foo and conservatively saves all callee-saved registers.
bar:
    addi  sp, sp, -32
    sd    ra, 16(sp)     # Save return address (missing before our PR)
    sd    s0, 8(sp)
    sd    s1, 0(sp)      # Unnecessary spill (foo won't clobber s1)
    call  foo
    ld    s1, 0(sp)      # Wasted reload
    ld    s0, 8(sp)
    ld    ra, 16(sp)
    addi  sp, sp, 32
    ret
After IPRA (optimized spills):
# bar now knows foo preserves s1: no s1 spill/reload.
bar:
    addi  sp, sp, -16
    sd    ra, 8(sp)     # Save return address (missing before our PR)
    sd    s0, 0(sp)
    call  foo
    ld    s0, 0(sp)
    ld    ra, 8(sp)
    addi  sp, sp, 16
    ret
By enabling IPRA for RISC-V, we eliminated redundant spills and reloads of callee-saved registers across function boundaries. In our example, IPRA reduced stack usage and cut unnecessary memory accesses. Crucially, the optimization maintains correctness: preserving the return address (ra) while pruning spills for registers like s1 when provably unused. Other architectures like x86 already support IPRA in LLVM, and we enable IPRA for RISC-V PR 125586.
IPRA is not enabled by default due to a bug, described in issue 119556; however, it does not affect the SPEC benchmarks.
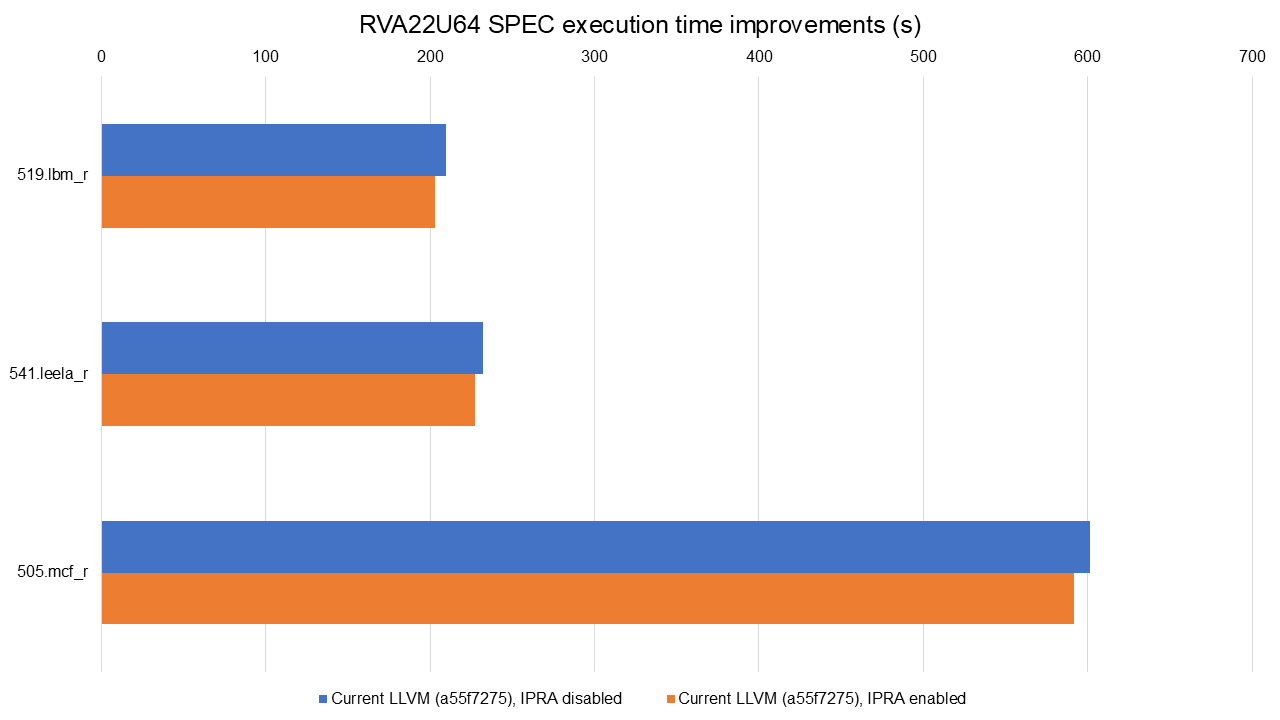
Full data available at https://lnt.lukelau.me/db_default/v4/nts/507?compare_to=526.
The graph shows the improvements achieved by this transformation alone, using the RVA22U64 profile. There were execution time improvements ranging from 1.57% in 505.mcf_r to 3.16% in 519.lbm_r.
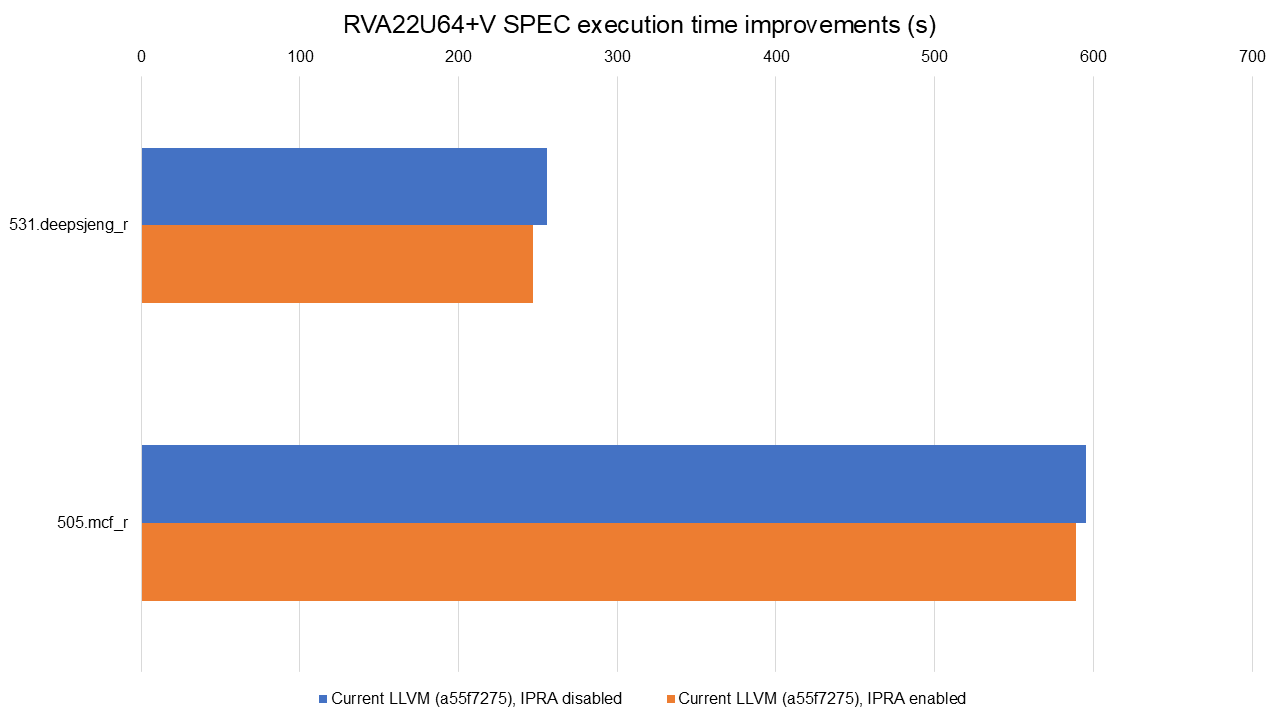
Full data available at https://lnt.lukelau.me/db_default/v4/nts/527?compare_to=525.
The graph shows the improvements achieved by this transformation alone, using the RVA22U64+V profile. We see similar gains, with execution time improvements of 1.14% in 505.mcf_r and 3.42% in 531.deepsjeng_r.
While we initially looked at code size impact, the improvements were marginal. Given that save/restore sequences tend to be a small fraction of total size, this isn't surprising and not the main goal of this optimization.
Challenges and Lessons Learned #
Setting Up Reliable Performance Testing. A key part of this project was being able to measure the impact of our changes consistently and meaningfully. For that, we used LNT, LLVM’s performance testing tool, to automate test builds, runs, and result comparisons. Once set up, LNT allowed us to identify regressions early, track improvements over time, and visualize the impact of each patch through clear graphs.
Reducing Noise on the BPI-F3. Benchmarking is noisy by default, and it took considerable effort to reduce variability between runs. These steps helped:
- Disabling ASLR: To ensure a more deterministic memory layout.
- Running one benchmark at a time on the same core: This helped eliminate cross-run contention and improved result consistency.
- Multiple samples per benchmark: We collected 3 samples to compute statistical confidence and reduce the impact of outliers.
These measures significantly reduced noise, allowing us to detect even small performance changes with confidence.
Interpreting Results and Debugging Regressions. Another challenge was interpreting performance regressions or unexpected results. Often, regressions weren't caused by the patch under test, but by unrelated interactions with the backend. This required:
- Cross-checking disassembly between runs.
- Profiling with hardware counters (e.g., using perf).
- Identifying missed optimization opportunities due to incorrect cost models or spill decisions.
- Comparing scalar vs vector codegen and spotting unnecessary spills or register pressure.
My colleague Luke Lau also set up a centralized LNT instance that runs nightly tests. This made it easy to detect and track performance regressions (or gains) shortly after new commits landed. When regressions did appear, we could use the profiles and disassembly generated by LNT to narrow down which functions were affected, and why.
Using llvm-exegesis (sort of). At the start of the project, llvm-exegesis, the tool LLVM provides to measure instruction latencies and throughput, didn’t support RISC-V at all. Over time, support was added incrementally across three patches: first for basic arithmetic instructions, then load instructions, and eventually vector instructions. This made it a lot more viable as a tool for microarchitectural analysis on RISC-V. However, despite this progress, we ultimately didn’t use llvm-exegesis to collect the latency data for our scheduling model. The results were too noisy, and we needed more control over how measurements were gathered. Instead, we developed an internal tool to generate the latency data, something we plan to share in the future.
Notable Contributions Without Immediate Benchmark Impact. While some patches may not have led to significant performance improvements in benchmarks, they were crucial for enhancing the RISC-V backend's robustness and maintainability:
- Improved Vector Handling in matchSplatAsGather (PR #117878): This patch updated the matchSplatAsGather function to handle vectors of different sizes, enhancing code generation for @llvm.experimental.vector.match on RISC-V.
- Addition of FMA Cost Model (PRs #125683 and #126076): These patches extended the cost model to cover the FMA instruction, ensuring accurate cost estimations for fused multiply-add operations.
- Generalization of vp_fneg Cost Model (PR #126915): This change moved the cost model for vp_fneg from the RISC-V-specific implementation to the generic Target Transform Info (TTI) layer, promoting consistent handling across different targets.
- Late Conditional Branch Optimization for RISC-V (PR #133256): Introduced a late RISC-V-specific optimization pass that replaces conditional branches with unconditional ones when the condition can be statically evaluated. This creates opportunities for further branch folding and cleanup later in the pipeline. While performance impact was limited in current benchmarks, it lays the foundation for smarter late-stage CFG optimizations.
These contributions, while not directly impacting benchmark results, laid the groundwork for future improvements.
The Future of RISC-V in LLVM #
This project significantly improved the performance of the RISC-V backend in LLVM through a combination of targeted optimizations, infrastructure improvements, and upstream contributions. We tackled key issues in vectorization, register allocation, and scheduling, demonstrating that careful backend tuning can yield substantial real-world benefits, especially on in-order cores like the SpacemiT-X60.
Future Work:
- Vector latency modeling: The current scheduling model lacks accurate latencies for vector instructions.
- Further scheduling model fine-tuning: This would impact the largest number of users and would align RISC-V with other targets in LLVM.
- Improve vectorization: The similar performance between scalar and vectorized code suggests we are not fully exploiting vectorization opportunities. Deeper analysis might uncover missed cases or necessary model tuning.
- Improvements to DAGCombine: after PR 130430, Philip Reames created issue 132787 with ideas to improve the store merging code.
Acknowledgments #
This work was made possible thanks to support from RISE, under Research Project RP009. I would like to thank my colleagues Luke Lau and Alex Bradbury for their ongoing technical collaboration and insight throughout the project. I’m also grateful to Philip Reames from Rivos for his guidance and feedback. Finally, a sincere thank you to all the reviewers in the LLVM community who took the time to review, discuss, and help shape the patches that made these improvements possible.