The Igalia WebKit team is happy to announce WebKitGTK+ 2.16. This new release drastically improves the memory consumption, adds new API as required by applications, includes new debugging tools, and of course fixes a lot of bugs.
Memory consumption
After WebKitGTK+ 2.14 was released, several Epiphany users started to complain about high memory usage of WebKitGTK+ when Epiphany had a lot of tabs open. As we already explained in a previous post, this was because of the switch to the threaded compositor, that made hardware acceleration always enabled. To fix this, we decided to make hardware acceleration optional again, enabled only when websites require it, but still using the threaded compositor. This is by far the major improvement in the memory consumption, but not the only one. Even when in accelerated compositing mode, we managed to reduce the memory required by GL contexts when using GLX, by using OpenGL version 3.2 (core profile) if available. In mesa based drivers that means that software rasterizer fallback is never required, so the context doesn’t need to create the software rasterization part. And finally, an important bug was fixed in the JavaScript garbage collector timers that prevented the garbage collection to happen in some cases.
CSS Grid Layout
Yes, the future here and now available by default in all WebKitGTK+ based browsers and web applications. This is the result of several years of great work by the Igalia web platform team in collaboration with bloomberg. If you are interested, you have all the details in Manuel’s blog.
New API
The WebKitGTK+ API is quite complete now, but there’s always new things required by our users.
Hardware acceleration policy
Hardware acceleration is now enabled on demand again, when a website requires to use accelerated compositing, the hardware acceleration is enabled automatically. WebKitGTK+ has environment variables to change this behavior, WEBKIT_DISABLE_COMPOSITING_MODE to never enable hardware acceleration and WEBKIT_FORCE_COMPOSITING_MODE to always enabled it. However, those variables were never meant to be used by applications, but only for developers to test the different code paths. The main problem of those variables is that they apply to all web views of the application. Not all of the WebKitGTK+ applications are web browsers, so it can happen that an application knows it will never need hardware acceleration for a particular web view, like for example the evolution composer, while other applications, especially in the embedded world, always want hardware acceleration enabled and don’t want to waste time and resources with the switch between modes. For those cases a new WebKitSetting hardware-acceleration-policy has been added. We encourage everybody to use this setting instead of the environment variables when upgrading to WebKitGTk+ 2.16.
Network proxy settings
Since the switch to WebKit2, where the SoupSession is no longer available from the API, it hasn’t been possible to change the network proxy settings from the API. WebKitGTK+ has always used the default proxy resolver when creating the soup context, and that just works for most of our users. But there are some corner cases in which applications that don’t run under a GNOME environment want to provide their own proxy settings instead of using the proxy environment variables. For those cases WebKitGTK+ 2.16 includes a new UI process API to configure all proxy settings available in GProxyResolver API.
Private browsing
WebKitGTK+ has always had a WebKitSetting to enable or disable the private browsing mode, but it has never worked really well. For that reason, applications like Epiphany has always implemented their own private browsing mode just by using a different profile directory in tmp to write all persistent data. This approach has several issues, for example if the UI process crashes, the profile directory is leaked in tmp with all the personal data there. WebKitGTK+ 2.16 adds a new API that allows to create ephemeral web views which never write any persistent data to disk. It’s possible to create ephemeral web views individually, or create ephemeral web contexts where all web views associated to it will be ephemeral automatically.
Website data
WebKitWebsiteDataManager was added in 2.10 to configure the default paths on which website data should be stored for a web context. In WebKitGTK+ 2.16 the API has been expanded to include methods to retrieve and remove the website data stored on the client side. Not only persistent data like HTTP disk cache, cookies or databases, but also non-persistent data like the memory cache and session cookies. This API is already used by Epiphany to implement the new personal data dialog.
Dynamically added forms
Web browsers normally implement the remember passwords functionality by searching in the DOM tree for authentication form fields when the document loaded signal is emitted. However, some websites add the authentication form fields dynamically after the document has been loaded. In those cases web browsers couldn’t find any form fields to autocomplete. In WebKitGTk+ 2.16 the web extensions API includes a new signal to notify when new forms are added to the DOM. Applications can connect to it, instead of document-loaded to start searching for authentication form fields.
Custom print settings
The GTK+ print dialog allows the user to add a new tab embedding a custom widget, so that applications can include their own print settings UI. Evolution used to do this, but the functionality was lost with the switch to WebKit2. In WebKitGTK+ 2.16 a similar API to the GTK+ one has been added to recover that functionality in evolution.
Notification improvements
Applications can now set the initial notification permissions on the web context to avoid having to ask the user everytime. It’s also possible to get the tag identifier of a WebKitNotification.
Debugging tools
Two new debugged tools are now available in WebKitGTk+ 2.16. The memory sampler and the resource usage overlay.
Memory sampler
This tool allows to monitor the memory consumption of the WebKit processes. It can be enabled by defining the environment variable WEBKIT_SMAPLE_MEMORY. When enabled, the UI process and all web process will automatically take samples of memory usage every second. For every sample a detailed report of the memory used by the process is generated and written to a file in the temp directory.
$ WEBKIT_SAMPLE_MEMORY=1 MiniBrowser
Started memory sampler for process MiniBrowser 32499; Sampler log file stored at: /tmp/MiniBrowser7ff2246e-406e-4798-bc83-6e525987aace
Started memory sampler for process WebKitWebProces 32512; Sampler log file stored at: /tmp/WebKitWebProces93a10a0f-84bb-4e3c-b257-44528eb8f036
The files contain a list of sample reports like this one:
Timestamp                          1490004807
Total Program Bytes                1960214528
Resident Set Bytes                 84127744
Resident Shared Bytes              68661248
Text Bytes                         4096
Library Bytes                      0
Data + Stack Bytes                 87068672
Dirty Bytes                        0
Fast Malloc In Use                 86466560
Fast Malloc Committed Memory       86466560
JavaScript Heap In Use             0
JavaScript Heap Committed Memory   49152
JavaScript Stack Bytes             2472
JavaScript JIT Bytes               8192
Total Memory In Use                86477224
Total Committed Memory             86526376
System Total Bytes                 16729788416
Available Bytes                    5788946432
Shared Bytes                       1037447168
Buffer Bytes                       844214272
Total Swap Bytes                   1996484608
Available Swap Bytes               1991532544
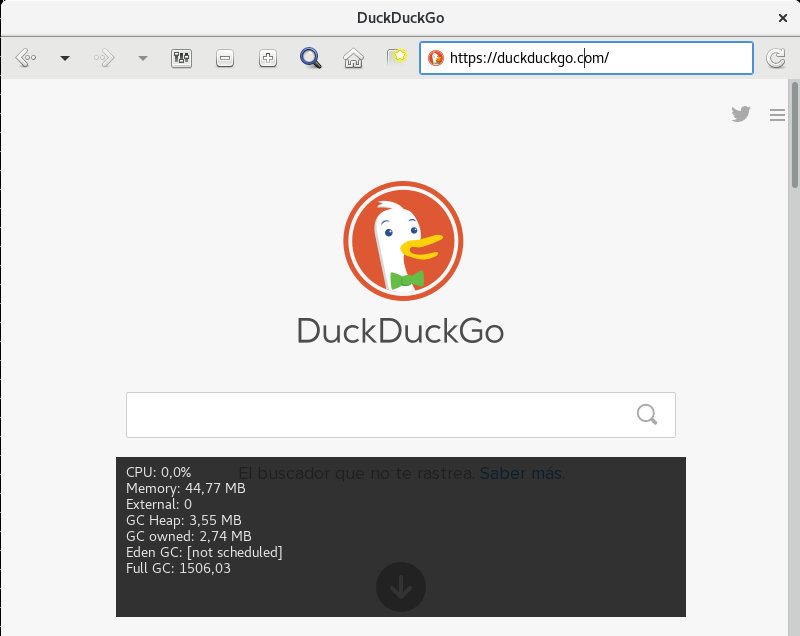
Resource usage overlay
The resource usage overlay is only available in Linux systems when WebKitGTK+ is built with ENABLE_DEVELOPER_MODE. It allows to show an overlay with information about resources currently in use by the web process like CPU usage, total memory consumption, JavaScript memory and JavaScript garbage collector timers information. The overlay can be shown/hidden by pressing CTRL+Shit+G.
We plan to add more information to the overlay in the future like memory cache status.